
Resources
Guide to creating a scientific presentation: format, best practices, and mistakes to avoid
Learn the best practices for crafting and delivering compelling, informative scientific presentations

Have you ever sat through a boring, scientific presentation?
Assuming you’re now on the other side of the stage — writing your own scientific presentation — you want to ensure that your audience stays engaged (and not fighting off yawns). This means transforming all your painstaking research into clear, powerful slides that tell a story.
A great scientific presentation is as much about storytelling as it is about data. But translating scientific findings, often packed with dry numbers, graphs, and formulae, into a captivating narrative is no easy feat.
To help, we’ve compiled the best practices for building an effective scientific presentation. You’ll learn how to structure the deck, refine slide content, use visuals effectively, prepare for the big day, and avoid mistakes along the way.
Understand your audience

First things first, remember to tailor the presentation and language to your audience. Get to know who the viewers are, then align the slide content, imagery, and delivery with their level of expertise, maturity, and interest. For example, if your audience comprises:
- Subject matter experts: Focus the content on striking new findings, and don’t hold back from using technical jargon. Complex charts, equations, and detailed methodologies are also fair game.
- General scientists: In your slide content, highlight the general impact of the findings and avoid using highly technical terminology unless you explain it. The graphics should be informative but simplified and easy to follow.
- Fellow science students: Structure your content in a way that balances foundational knowledge and the details of your research. Use simple, clearly labeled visuals to reinforce your findings, and walk the audience through them.
- General public: Distill the “how” of your findings into a few easily graspable slides, but focus more on the “why”. The visuals should be engaging and clear enough for a layperson to understand, while the delivery should be structured as a narrative to keep the presentation engaging.
Not sure if your presentation is tailored well enough for your viewers? Get a peer or someone from the same demographic as the intended audience to review your efforts and give you feedback.
Need a quick way to reword or rewrite your slides for the right audience? Try using Plus AI’s rewrite feature and tell it who you are presenting to.
Suggested format for a scientific presentation

Most scientific presentations are structured like this:
- Introduction: Outline the problem and why it’s an important one to tackle. Briefly explain how your research attempts to do so.
- Methods: Dive into the methodology behind your research. Clearly outline the approach, the tools you’ve used, and the people or organizations you’ve collaborated with.
- Results: Present the findings of your research. Clear, relevant graphics will help you reinforce information delivery.
- Discussion: Share your interpretation of the results and explain how you connect the outcome to the problem. This is a good time to point out any caveats and limitations.
- Conclusion: Summarize the key outcomes and bring up any future opportunities for research.
- Q&A session: Give the audience a chance to ask you relevant questions.
However, if you are presenting to a more general audience or people who are unfamiliar with your work, it might be helpful to enhance the “story” and narrative arc of the presentation. For example, you might want to rethink a few sections:
- Introduction: Tell the story of how you first came across this problem or insight.
- Methods: Explain how other people have approached this problem in the past and what you did differently.
- Results: Focus on the one key result that you want people to remember.
- Discussion: Share a story or anecdote that surprised you about the research findings.
- Conclusion: Quickly tell the end-to-end story again to help people remember
It’s always great to turn presentations into “stories,” but depending on your audience the highlight of the story might be your own story of how you fell into this research vs. the detailed research findings themselves.
Best practices for creating scientific slide content

Poorly written slide content overwhelms, bores, confuses, and leaves glaring information gaps. To make sure your slides look good and tell the story, follow these best practices:
- Define key terms after the intro
- Limit each slide to a single idea
- Use informative slide titles
- Limit slide body text to key points
- Prioritize visuals and data
- Maintain contextual flow between slides
- Cite your sources
Define key terms after the intro
Is your presentation overflowing with scientific terms? If so, unless your audience comprises a panel of experts, either dedicate a slide to defining all terms up-front or make sure you define key terms throughout the presentation.
Limit each slide to a single idea
Avoid making too many contextual pivots in a single slide — you’ll confuse and overwhelm the audience. For the sake of clarity, dedicate each slide to a single, distinct idea.
Use informative slide titles
Leave information gaps out of slide titles: You’re not writing clickbait; there’s no need to build suspense. Each heading should neatly summarize the slide in a succinct sentence; you’ll then expound on it in the slide’s body.
Limit slide body text to key points
Scientific presentations are data-heavy, and you may be tempted to ram all that info into the slides. But this approach produces no good outcomes. There’s no chance the spectators will be able to read it even if — and that’s big if — they want to. You probably won’t get very far reading paragraph-format slide content, either, before sending the viewers off to sleep.
Instead, distill all the data you want to share into clear, legible bullet points.
Prioritize visuals and data
You’ll see us advocating the use of storylines as an engagement tool, but that doesn’t mean that the narrative should dominate the slides themselves. If you’re structuring the presentation as a story, great! But the narrative is just useful “packaging” that helps you sell the meat and potatoes of the presentation — the data stemming from your research and findings. So, keep all superfluous talking points in your mind (or in the speaker’s notes) and let the slides present the data.
Maintain contextual flow between slides
Given the density of information, you may not pay much attention to the sequence in which you present it. We’ve discussed the ideal presentation structure above, but within each section, the slides should transition logically from one to the next.
✅ Here’s a good example of a smooth contextual transition between slides:
- Slide one: explains that air pollution negatively affects lungs
- Slide two: presents evidence of poor lung function in urban centers
This sequence works because the second slide presents data that reinforces the claim made in the first one.
❌ And here’s a bad one:
- Slide one: states that air pollution is a growing concern
- Slide two: presents evidence that COPD is on the rise
This sequence fails to establish a sound logical link between the two slides. You could easily fix it by inserting a new slide after the first one, explaining that air pollution contributes to the onset and progression of COPD.
Cite your sources
The chances are that a good deal of your slide content is based on scientific sources. Be sure to cite these sources using concise, in-slide citations.
How to use visuals effectively

Given the information density of scientific presentations, visuals are a crucial tool for maintaining engagement, breaking up monotony, and clarifying complex concepts. However, all the graphics you use must add value to your presentation. To make sure that the visuals enhance your presentation instead of detracting from its message, follow these simple best practices:
- Choose the right type of visual
- Maintain clarity
- Label the visuals clearly
- Use colors effectively
- Go easy on animations
Choose the right type of visual
Choose the graphics based on the type of data you’re presenting. For example, if you’re comparing data points, use a bar graph; if you’re examining trends, opt for a line graph; if the slide shows a correlation between variables, use a scatter chart. Diagrams help illustrate abstract concepts, while tables lay out numerous data points in an easily digestible manner.
Maintain clarity
As with slides that have written content, those presenting visuals should focus on a single idea. Ideally, this means 1 slide equals 1 graphic.
Label the visuals clearly
Whether it’s a bar graph, a pie chart, or a schematic diagram, chances are the visual is loaded with data points. Unless you label them clearly, they’ll be indecipherable to the audience. To avoid confusing the viewers and losing their attention, label each element of the visual clearly.
Use colors effectively
Colors aren’t just there for aesthetics: Their primary function is to make the graphics you’re presenting legible. For instance, using similar hues to depict elements that should be visually distinct — for example, beige label text on a white-background chart — is a no-no because there’s not enough contrast. Conversely, bright green and red elements used together provide so much contrast that, again, legibility suffers, and the graphic is just not aesthetically pleasing. Likewise, neon colors and a vast assortment of different hues are not easy on the eyes.
Go easy on animations
Excessive use of animations detracts from your message, wastes valuable time, and gives the presentation a gimmicky feel. Imagine having to backtrack a few slides — how annoyed and silly would you feel seeing all those “cool” transitions gumming up the process?
Instead of inserting animations to facilitate slide transitions, use them to highlight key findings, illustrate a sequence, or gradually reveal different elements to avoid overloading the viewers with information.
Learn to build scientific presentations quickly with the power of AI
Scientific presentations can take weeks or even months to prepare. Alas, there’s no way to speed up core tasks, like organizing your research or coming up with graphics that back up your findings.
That said, a quality AI slide maker can facilitate the deck creation by taking on the more tedious processes. With an app like Plus AI, distilling all that data you’ve spent a long time collecting into a slide deck becomes a breeze. For example, using Plus AI’s document-to-presentation feature, you can upload a file with all the source materials, and the AI app will generate a slide deck for you. It will intuitively map the content to slides so that you don’t need to worry about logical flow or converting difficult passages into legible bullet points. You’ll also get access to a library of templates, each of which gives the deck a professional, polished appearance.
How to use Plus AI to create a scientific presentation
There are several ways to build a scientific presentation with Plus AI:
- Using the document-to-presentation function — works best if you have all the materials necessarily in a file
- Slide-by-slide — good option if you already have a presentation outline and want full control of the process
- From a prompt — best way to start from scratch
Let’s take a closer look at each method.
Document-to-presentation
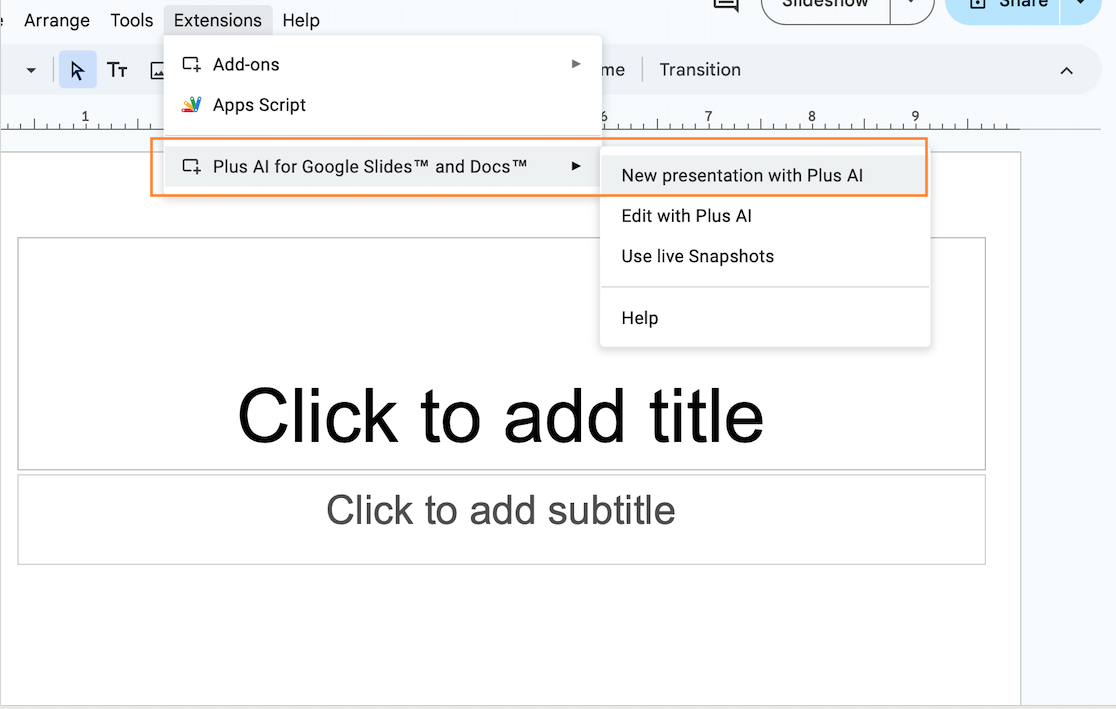
- Launch the Plus AI app, then navigate to “New presentation with Plus AI.”
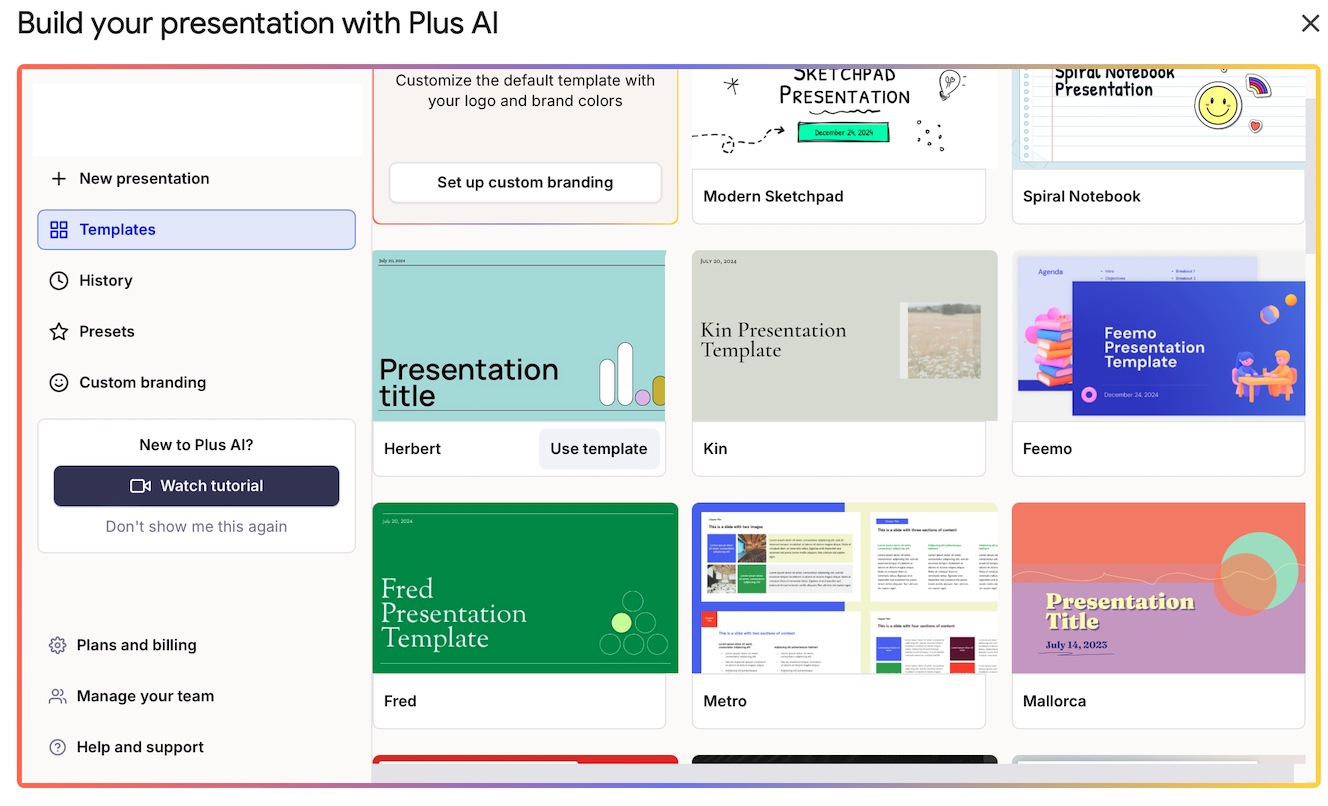
- Browse through the templates. You can hover your cursor over each template to see how the individual slides will look. Click on one you like best.
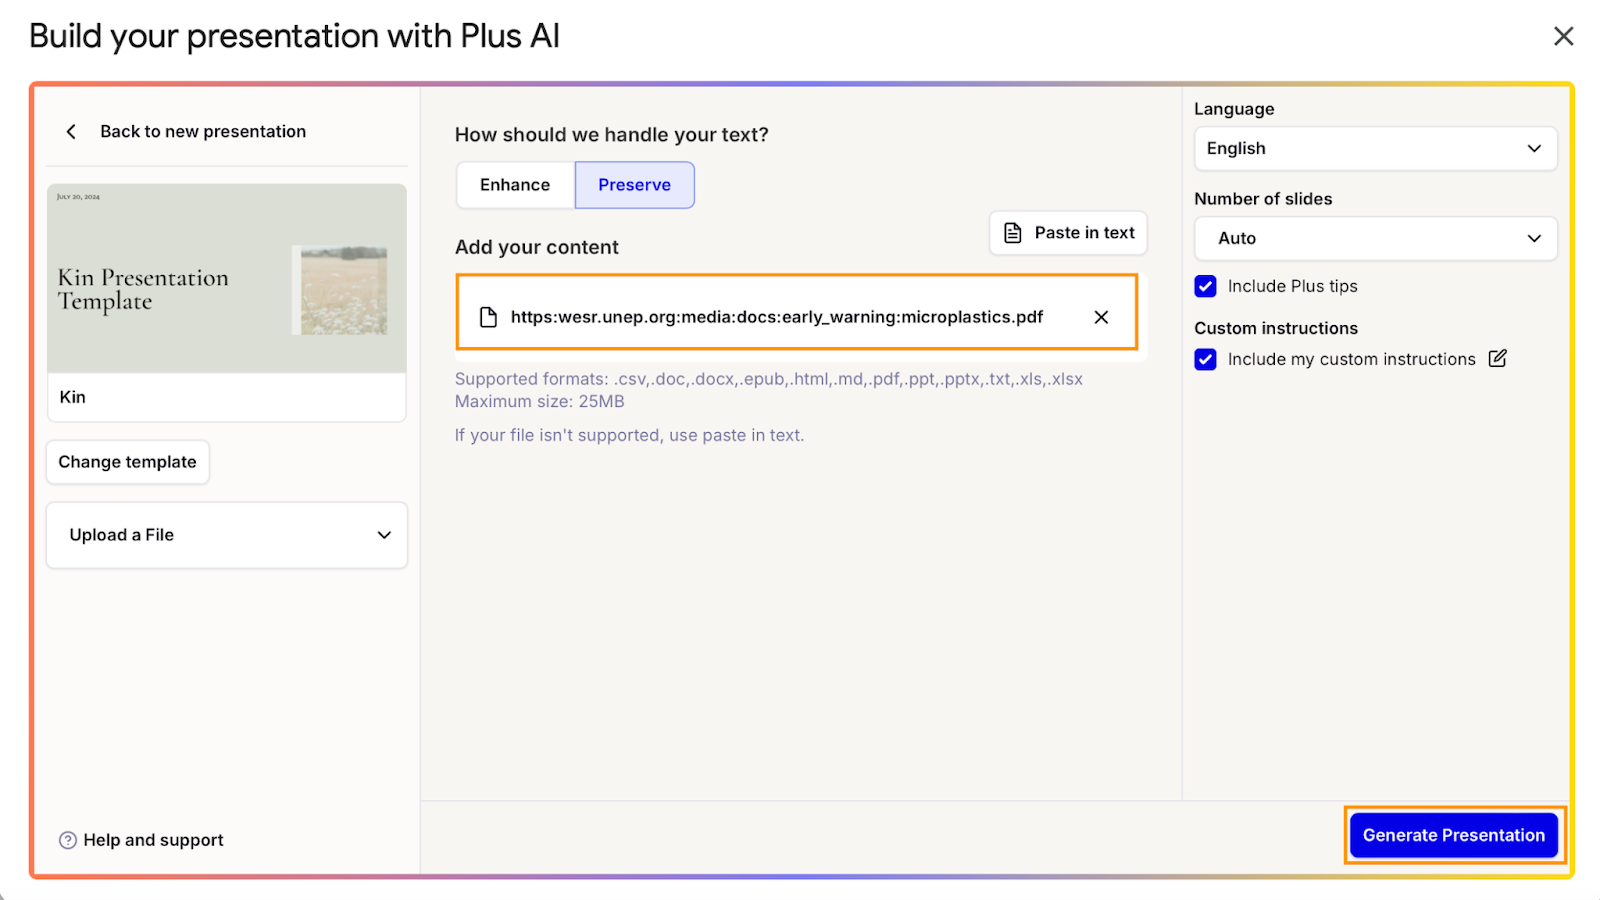
- Go to “Upload a file”.
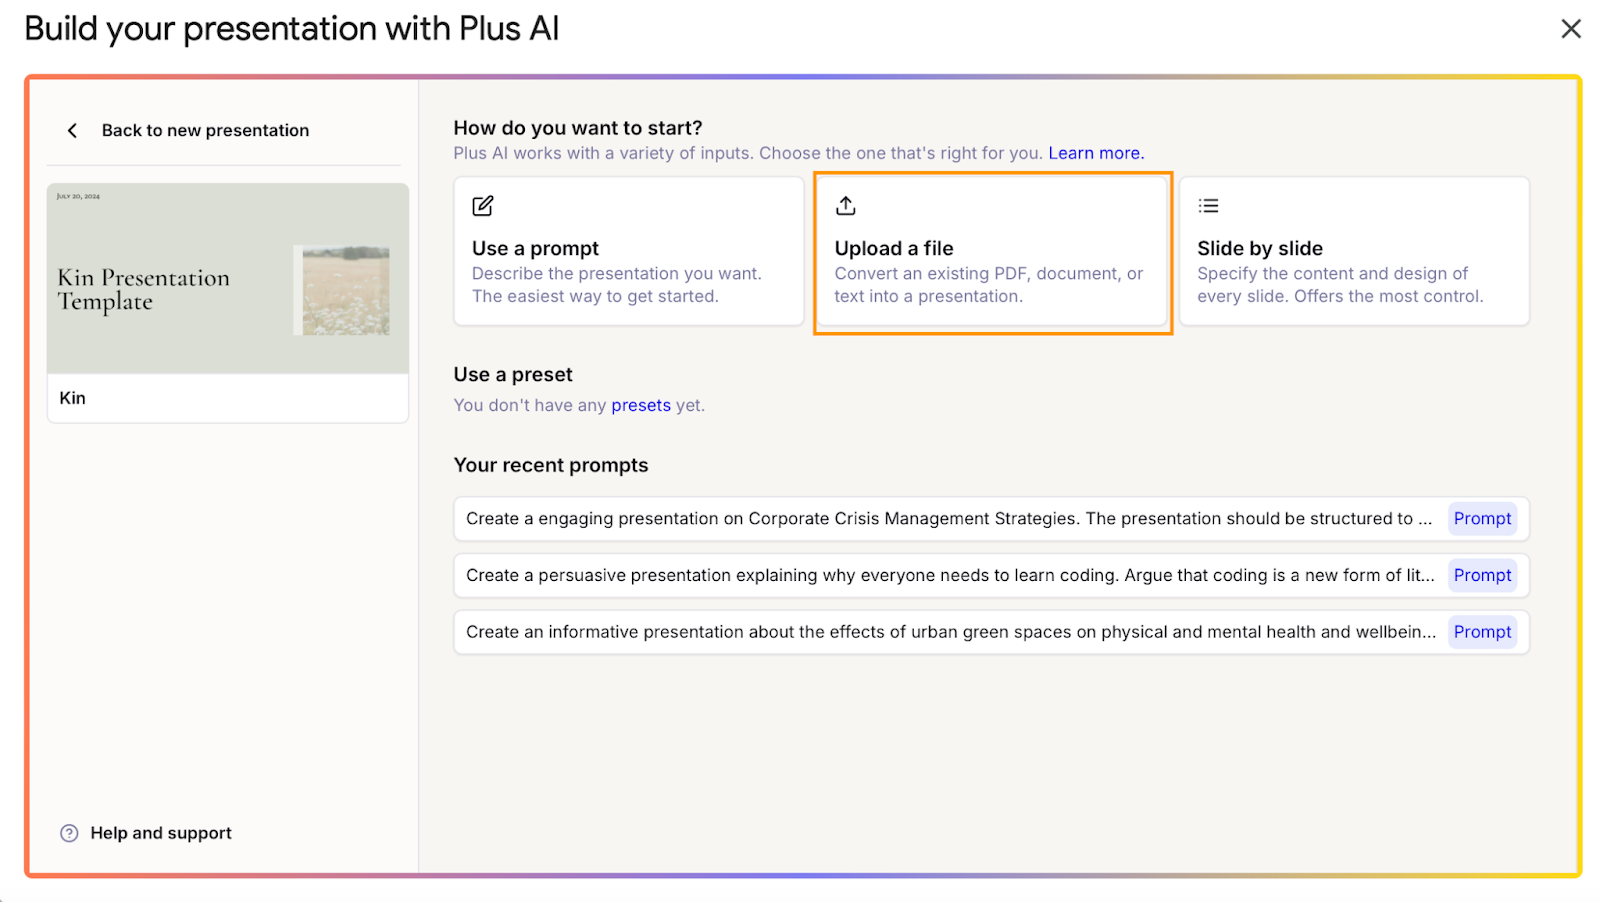
- Find the file with the source materials on your desktop and upload it. If you’re working with multiple documents, copy and paste the pertinent text passages into the prompt window instead. Click on “Generate Slides” when ready.
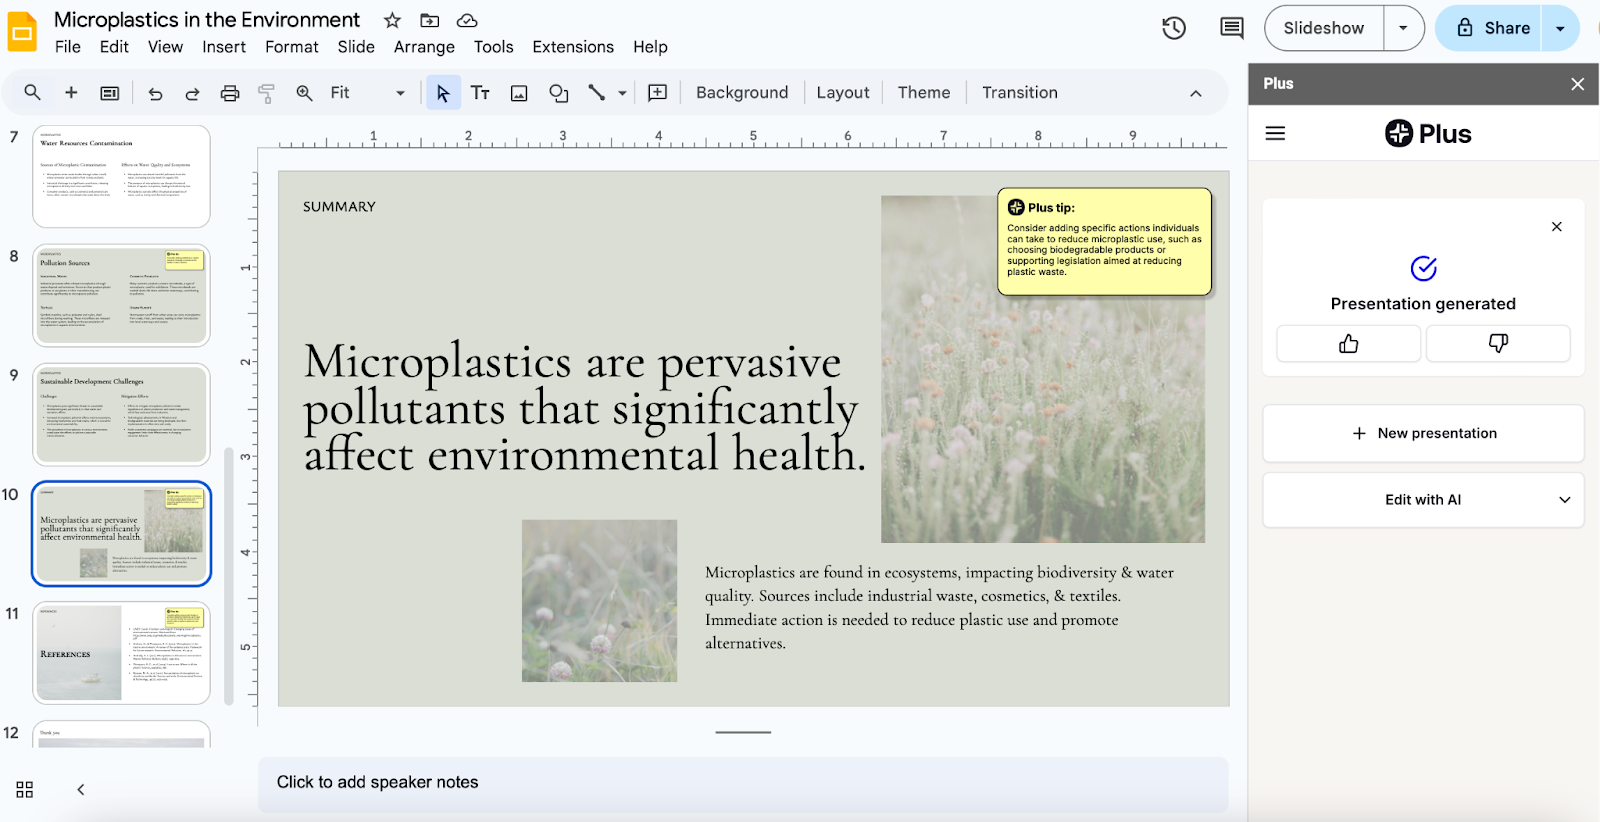
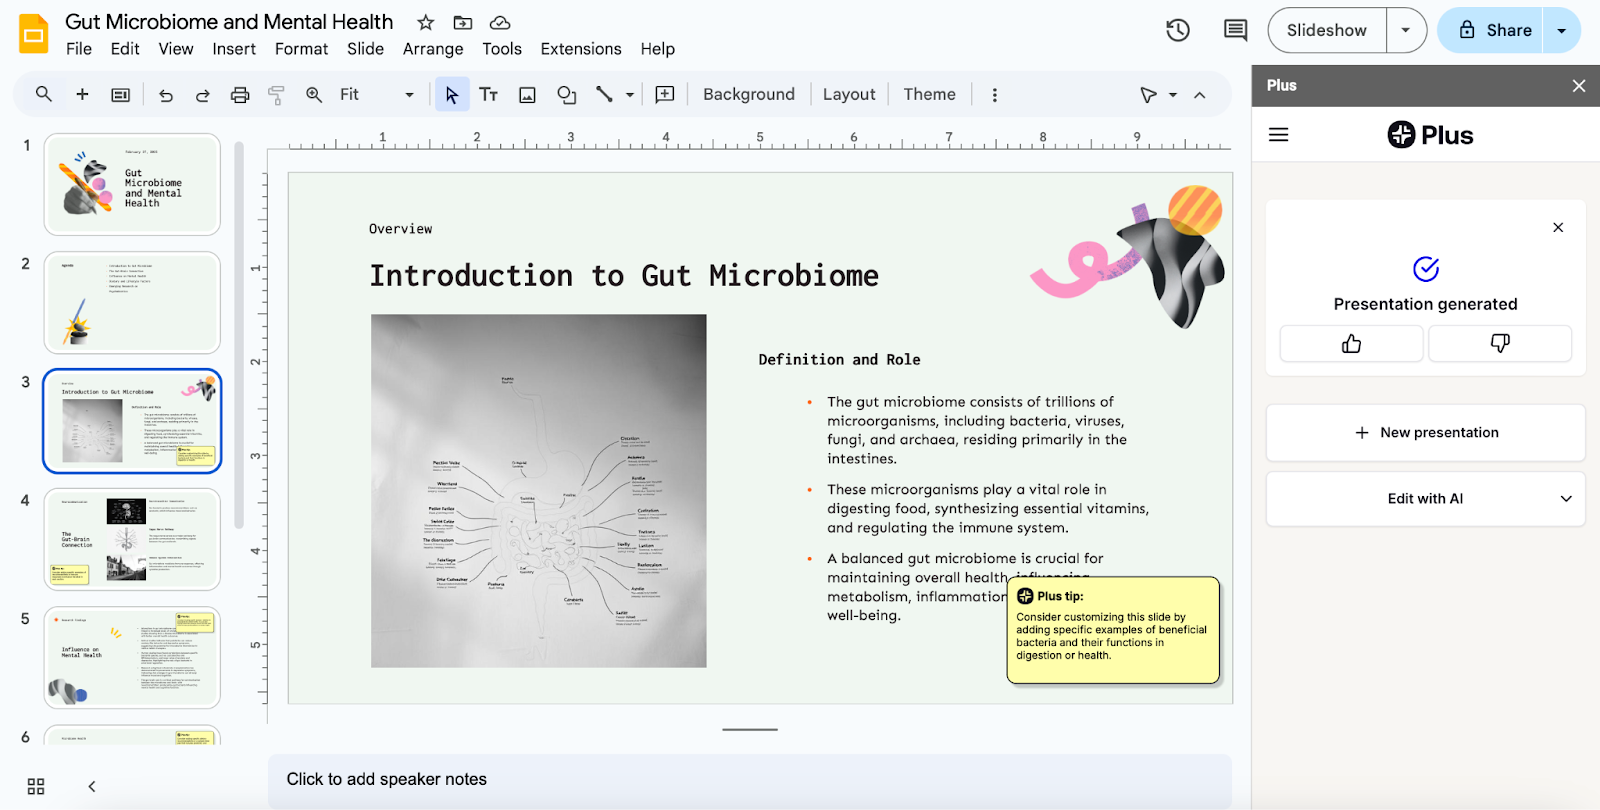
- Review the auto-generated presentation. This is your chance to refine the deck to your liking. You can edit manually or use the app’s suite of AI editing features.
From a prompt
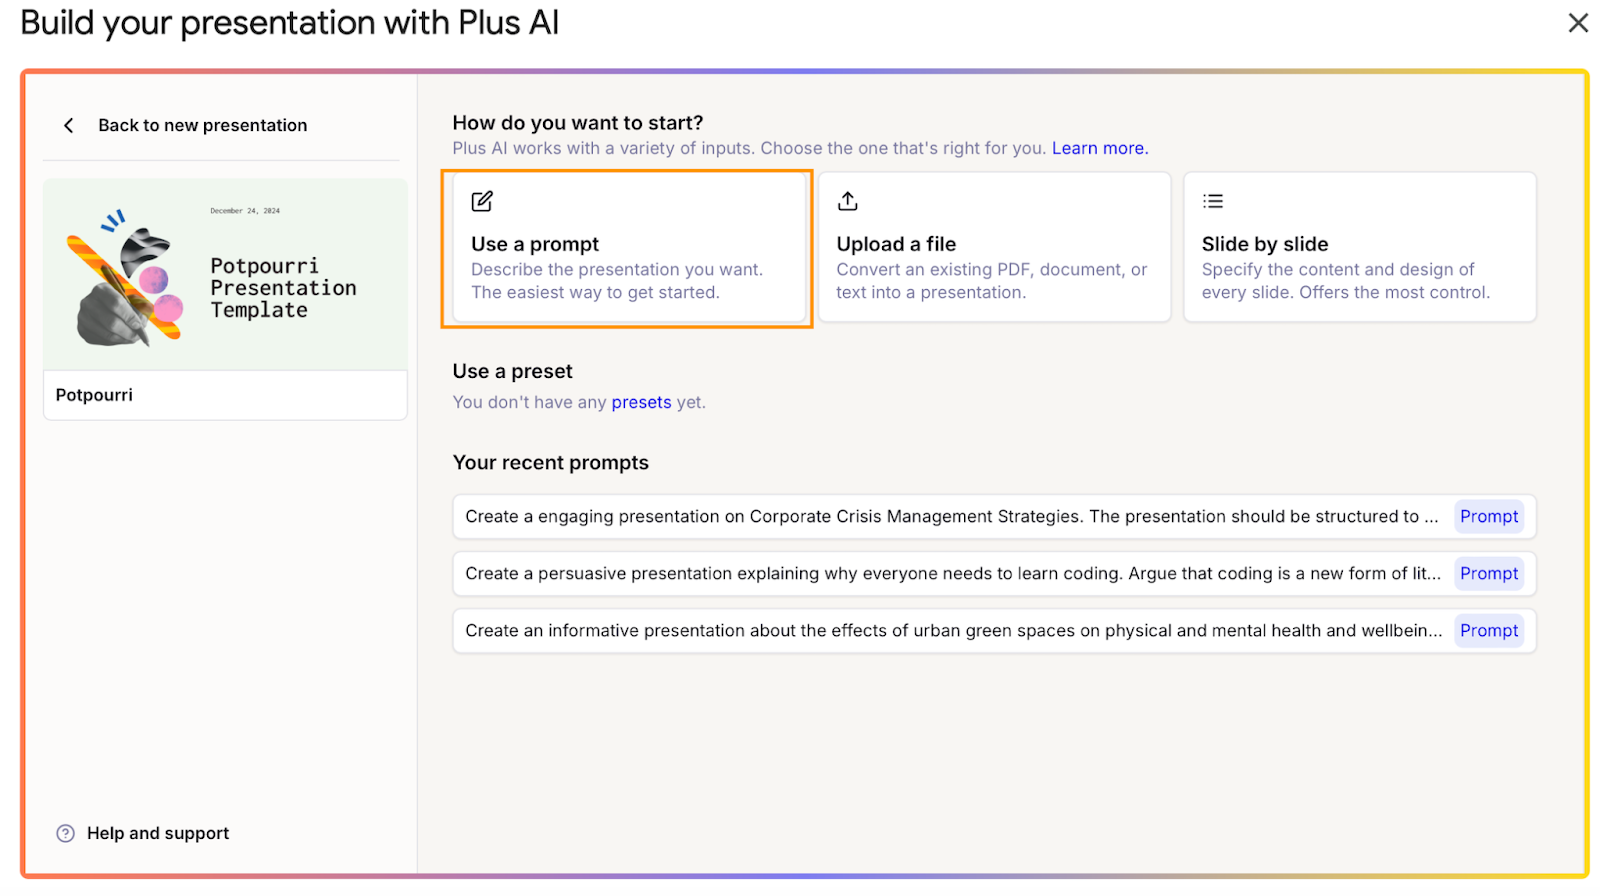
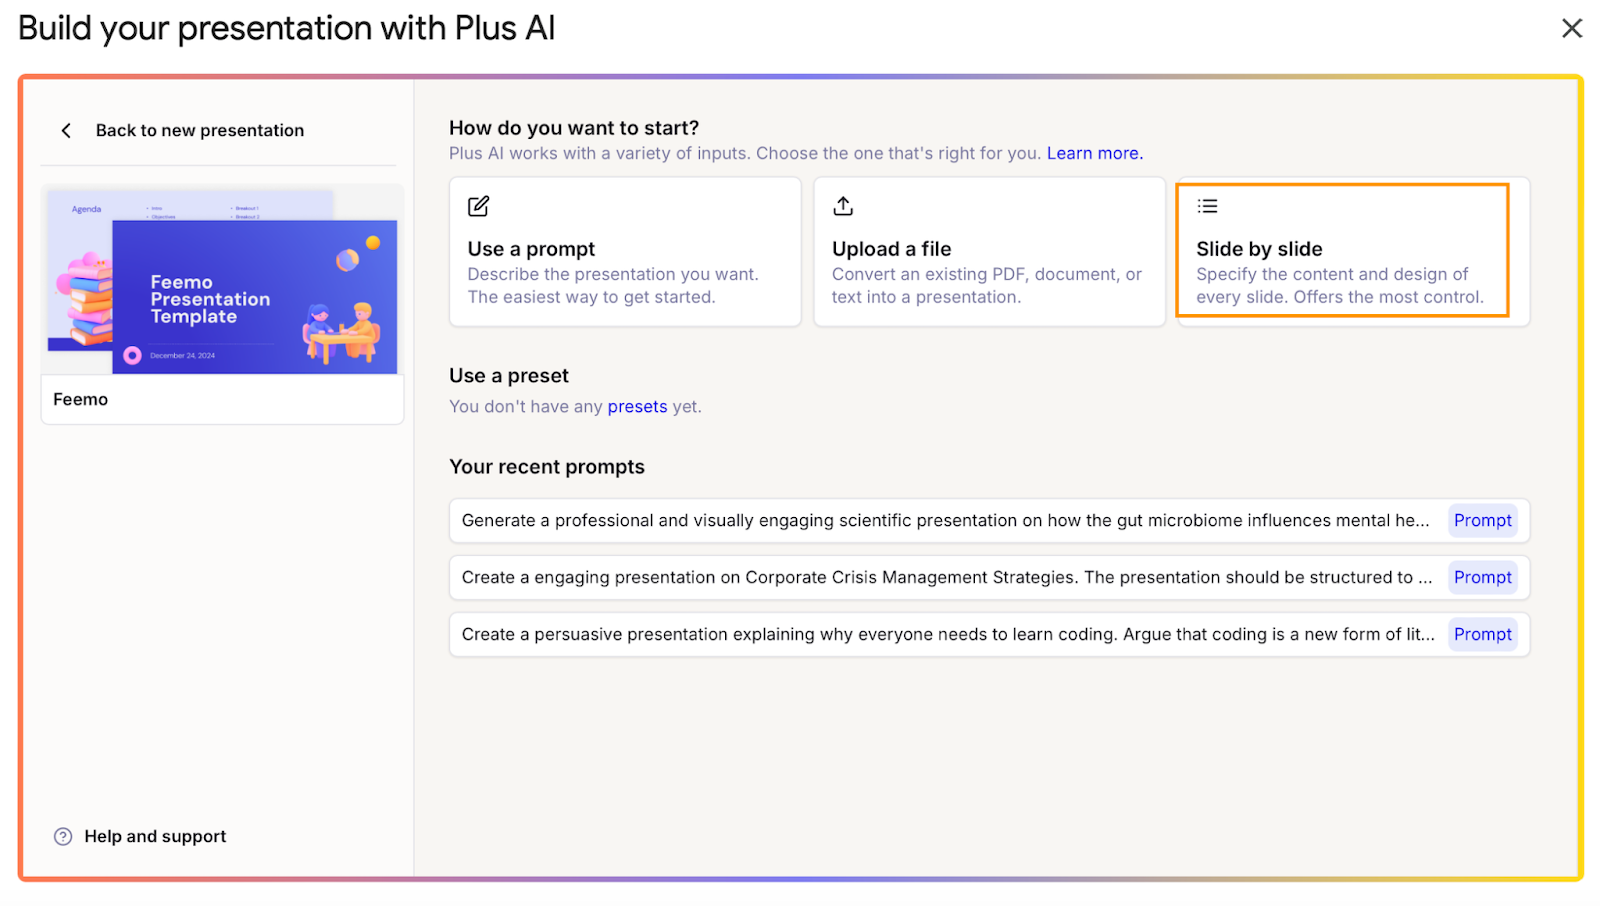
- Launch Plus AI, go to “New Presentation,” find a template, and choose the “Use a prompt” option.
- Describe your presentation in a prompt. Long, detailed prompts work best — the more context you give an AI model, the closer its output will align with your expectations. And with Plus AI, your prompts can be as long as 100,000 characters — that’s about 20,000 words.
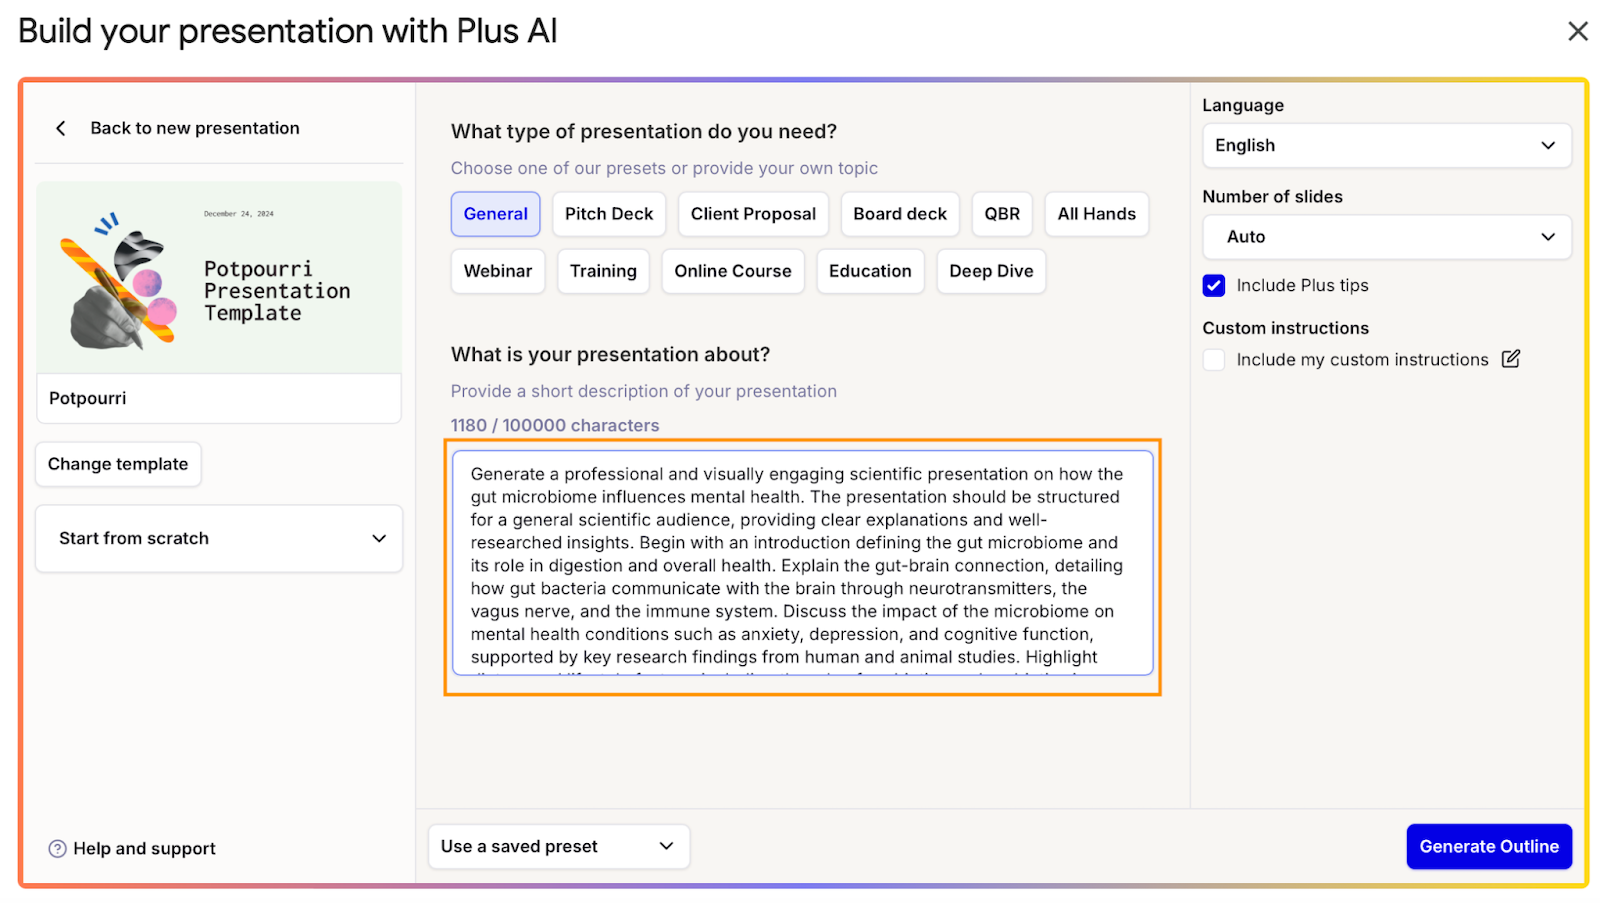
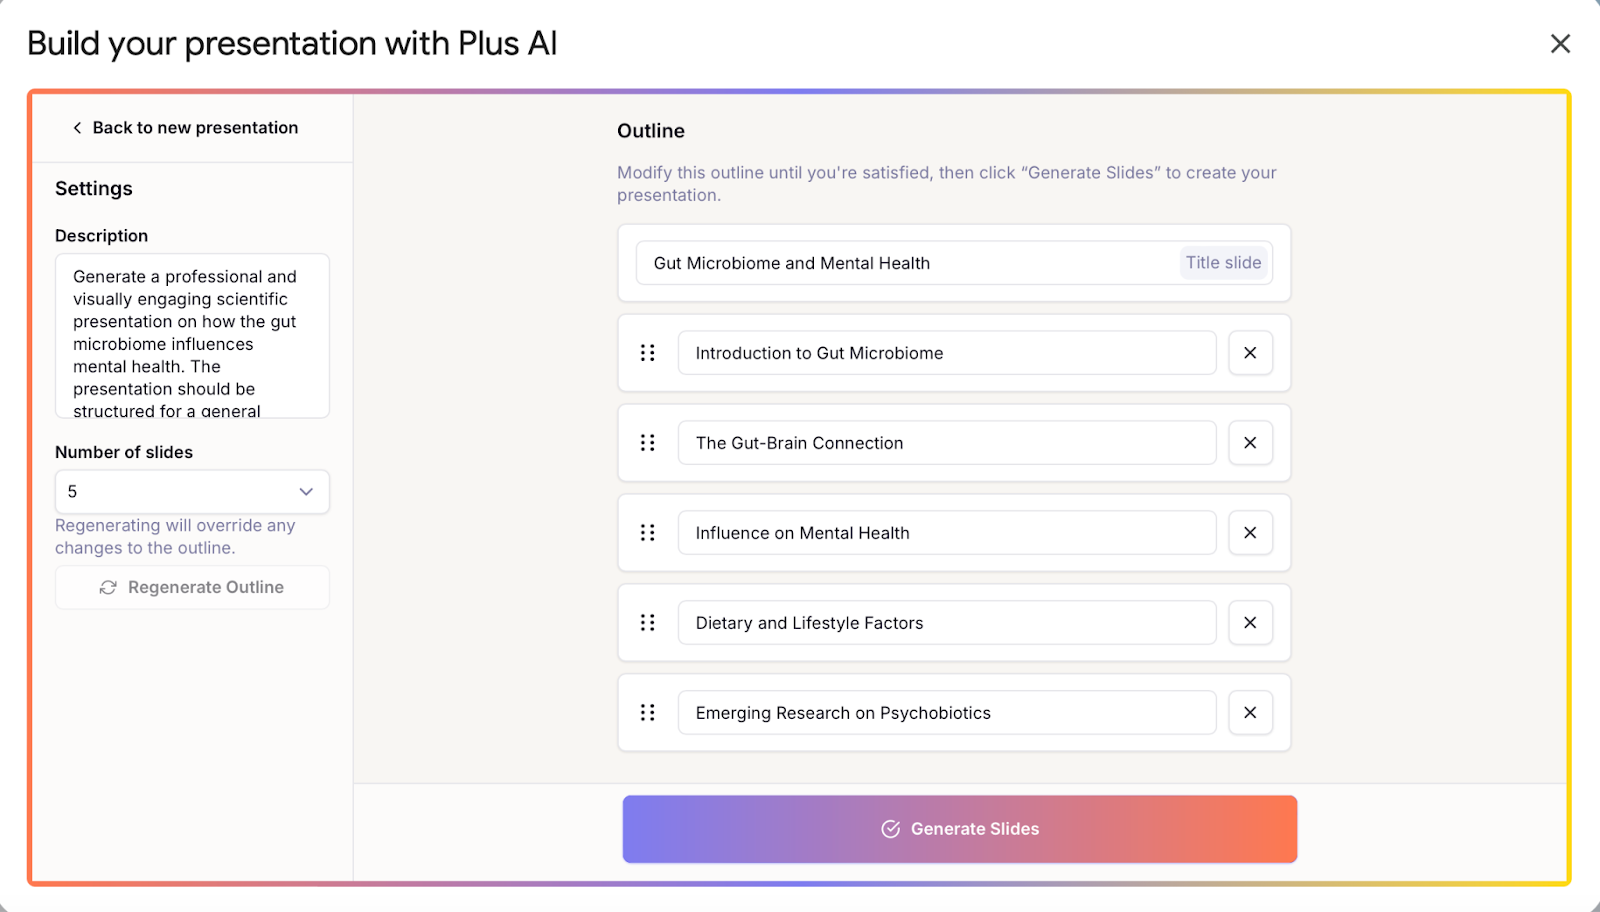
- Review the outline. Even though you’re starting off with nothing more than a prompt, you still exert plenty of control over the output. Once Plus AI generates an outline, you have a chance to reorder the slides and change their titles and content. When the outline is ready, click on “Generate Slides” and sit back.
- Review and polish the slide deck.
Slide-by-slide
- Launch Plus AI, go to “New Presentation,” find a template you like, and click on “Slide-by-slide.”
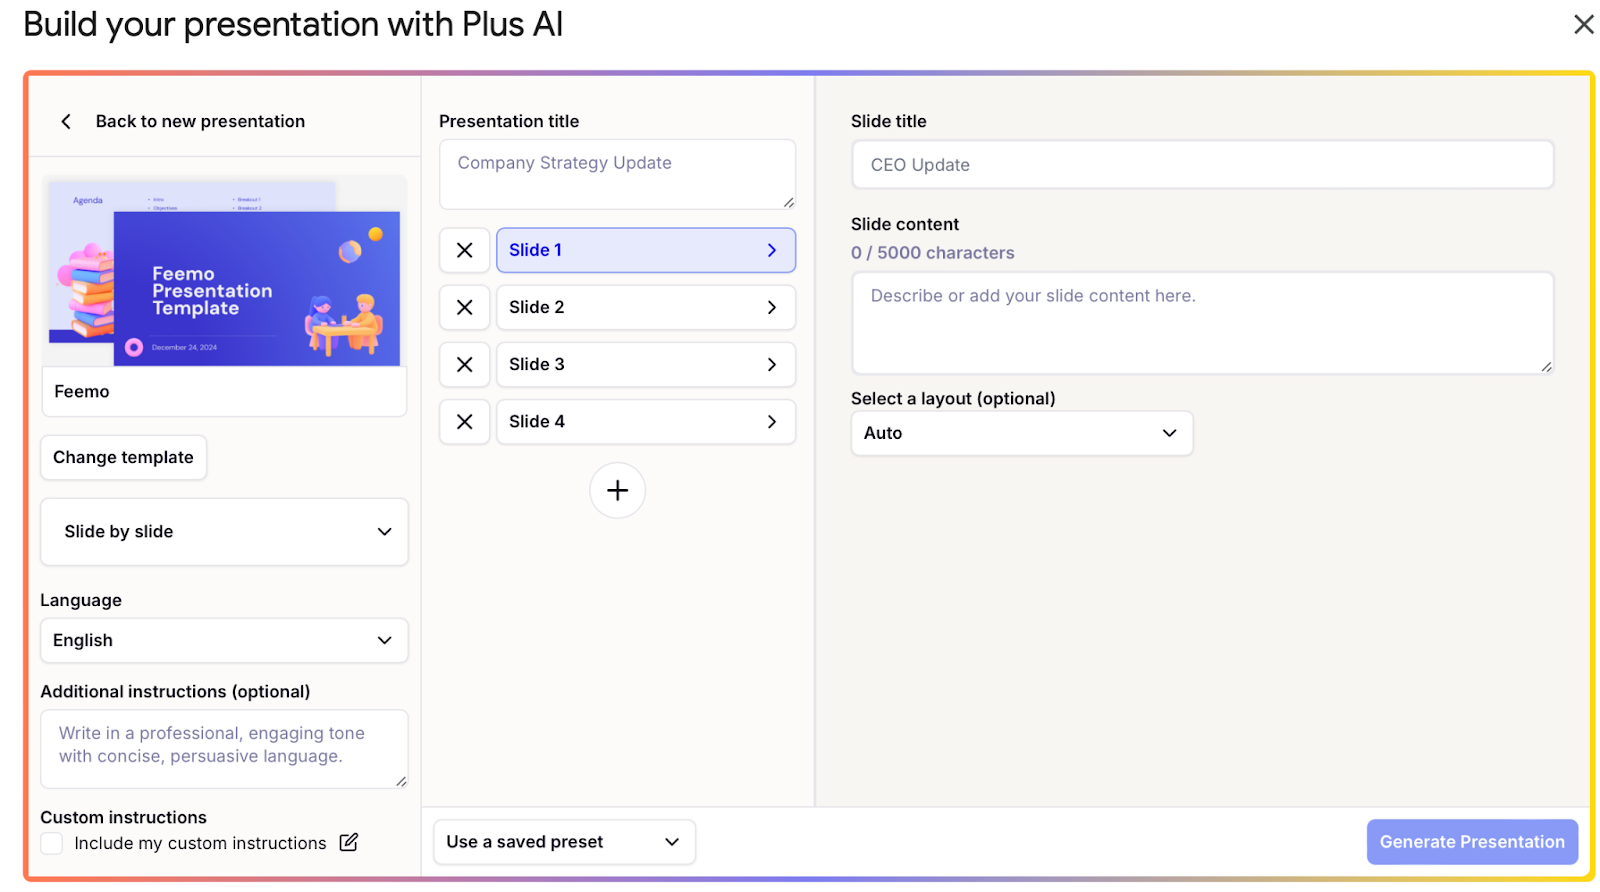
- Build an outline. You can specify the number of slides, arrange them as you like, and then enter individual prompts for each of them. Once you’re happy with the outline, click on “Generate Slides” and Plus AI will produce a deck.
Common mistakes to avoid when building a scientific slide deck
If you’re new to making scientific slides, you might feel a bit overwhelmed at the idea of transposing a ton of information into a legible, engaging deck. This state of mental overload can lead you astray and cause you to make some fairly consequential errors. Here are some to avoid:
- Overstuffing the slides
- Overdoing it with graphics
- Using irrelevant images
- Veering off-topic
- Relying on a one-way information flow
- Not giving the audience a mental break
Overstuffing the slides
Between the plethora of different ideas and verbose content, you’ll quickly lose your viewers. Stick to one idea per slide, and minimize the content to several bullet points. Keep sentences short: Don’t use 10 words when four will do.
Overdoing it with graphics
Graphics help you present findings and serve as a nice visual break. But use too many, and you’ll distract the viewers from the subject matter.
Using irrelevant images
Apart from the odd bit of comic relief in the form of a meme or GIF, any images you use should be tightly related to the topic at hand. Over-relying on stock images — especially where the content doesn’t warrant their use — will make your presentation seem less professional.
Veering off-topic
It may be easy to go off-topic as you discuss your findings or lay out the foundational concepts surrounding your research. But doing so will, once again, cause confusion and shorten your viewers’ attention spans.
Relying on a one-way information flow
You may have done all the research and have all the data, but you should plan for a bit of back-and-forth with the viewers if you want them to stay engaged. Q&A sessions are great, but you can do more to encourage viewer participation throughout the session. For example, you can solicit input after outlining the problem or simply give the audience a chance to ask questions every time you discuss a complex topic.
Not giving the audience a mental break
Scientific topics are info-dense, and, despite your best efforts, the endless flow of data can be hard to follow after a point. By giving the audience well-timed mental breaks, you’ll give them a chance to recover, recharge their batteries, and process the information they just absorbed.
Short discussion sessions will help cement the knowledge and assess it critically while also hitting pause on the firehose of data. Telling a relevant, engaging anecdote can also provide a much-needed respite from the slide content. If the presentation is excessively long, there’s nothing wrong with breaking up the tedium with a coffee break.
Tips for delivering a scientific presentation effectively

Even with a well-built slide deck, your presentation can fall flat if you don’t deliver it effectively. Here are a few simple tips to help you on the big day:
- Maintain eye contact with the audience
- Speak clearly and maintain a moderate pace
- Explain each visual
- Test the presentation on a big screen
- Practice, practice, practice
- Anticipate questions
Maintain eye contact with the audience
You probably already know that reading from your slides during a presentation is a bad idea. But you may still be tempted to glance at the screen to avoid your viewers’ gaze. Here’s how to overcome this faux pas and make the delivery more engaging:
- Make natural eye contact with different individuals as you speak
- Don’t lock eyes with the same person repeatedly or for too long
- Scan the entire room, not just the front row
Speak clearly and maintain a moderate pace
Every word you utter matters, so speak legibly and don’t rush the pace. You want to give the audience a chance to hear and process the information as you go along. At the same time, don’t linger or make excessive pauses, either.
Explain each visual
Even with an expert audience, you shouldn’t assume that everyone will understand your graphics at a glance. Take the time to walk the spectators through the graphics as they appear on the screen.
Test the presentation on a big screen
The bullet points, bar graphs, and schematics may look great on your laptop but turn into a jumbled mess once they’re up on a big screen. To avoid these unpleasant surprises, preview the slideshow on a big screen — ideally at the venue where you will present. This “dress rehearsal” gives you a chance to make sure that the audience will find the slides as clear and legible as you did while building the deck.
Practice, practice, practice
Spend time rehearsing your speech several times before the big day arrives. Not only will practice hone your delivery and acquaint you better with the slide content, but it will give you that vital ingredient every great presenter needs — confidence.
If possible, get a peer to sit in on your rehearsals. They’ll be able to point out flaws and inconsistencies, and you’ll get more used to speaking in front of a real audience.
Anticipate questions
Whether it’s a sole Q&A session at the end or you’re planning to field queries throughout, you must be ready to answer potential questions confidently. Brainstorm possible questions and ask friends or colleagues to help you compile a list, then come up with answers. Practice answering during your rehearsals.
FAQs about scientific presentations
How do you make a good scientific presentation?
- Prioritize structure and clarity. The structure of the presentation should follow a logical flow, and the slide content should be concise and clear.
- Tailor the content to the audience’s level of knowledge, interest, and involvement in the topic.
- Thoroughly explain highly technical terms, concepts, and graphics — even if you’re presenting before a panel of experts.
- Use relevant visuals, interactive elements, and storytelling techniques to make the presentation more engaging.
What should be included in a scientific presentation?
Every scientific presentation should include at least a problem statement or hypothesis, the research method, findings, and a conclusion. How these elements are constructed will hinge on the topic at hand. Also, depending on the subject matter, the presentation may need to include certain visuals with supporting data.
How long should a science presentation be?
It depends on the event type. For example, conference presentations can go on for about 15 minutes. Meanwhile, a keynote presentation or a lecture delivering your research findings would be longer — as long as 45 minutes, if needed.