Sometimes, a case study presentation can feel like a dry, tedious report.
Presenting a case study without a strong storyline, showing too much extraneous information, or not framing the case with an interesting decision or takeaway can make your presentation fall flat.
On the other hand, a well-structured case study can be a fun and engaging way to share information with your audience in the form of a story.
In this article, we’ll walk you through the elements of a strong case study presentation, the ideal structure, and tips for effective delivery.
{toc}
The key elements of a powerful case study presentation
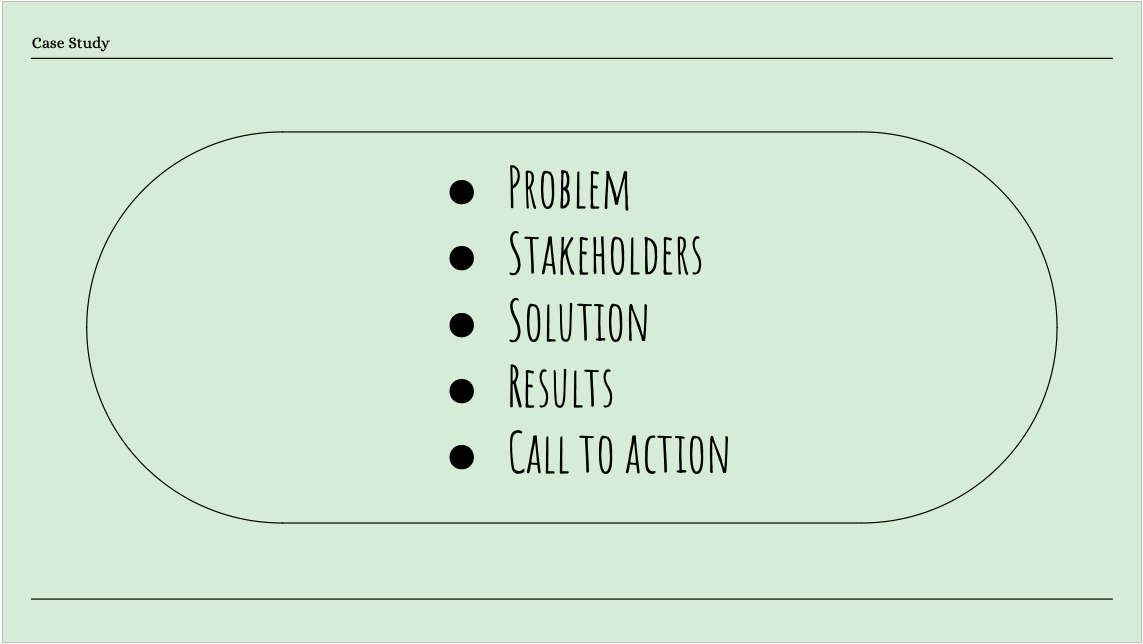
Despite potentially diverging in subject matter, all case study presentations should be grounded in the same structural elements:
- Problem
- Stakeholders
- Solution
- Results
- Call to action (CTA)
The problem
The whole point of a case study presentation is to show how a specific solution works in practice to resolve a problem. So, naturally, you’ll have to start the presentation by clearly outlining the problem clearly for the viewers.
How you approach this task hinges on the subject matter and the audience sitting before you. For instance, in a scientific presentation, you may want to lead with the hypothesis or research question. Meanwhile, a business presentation should highlight a specific moment in time when someone had to make an important decision.
The stakeholders
Case study presentations involve numerous stakeholders. These typically include:
- The subject: The individuals, groups, or organizations affected by the “problem”.
- Key decision-makers: Those who led the change or introduced the solution.
- Implementation team: Individuals or organizations who executed the solution.
- End user beneficiaries: Stakeholders who benefited from the solution.
Depending on how you structure the presentation, you may end up introducing all the stakeholders at once, or organically, as their role appears in your storyline.
The solution
This is the method or product that’s meant to resolve the problem. Describe how it was implemented to address the problem, explaining why it was chosen and how the implementation processes worked. Likewise, include relevant data and theories that support the choice of this particular solution and state which stakeholders were responsible for selection and implementation.
The results
The results of the case study should comprise measurable outcomes, including the data, statistics, or other performance indicators that show the effectiveness of the solution. In some cases, you’ll want to compare the before and after states to highlight the difference between the initial conditions and the improvements brought about after implementing the solution. To give the solution more credibility, back it up with stakeholders’ testimonials and reveal any challenges or limitations that came up.
After discussing the results, you can hold a Q&A session to address any questions or concerns. Alternatively, the Q&A can happen after the final element of the presentation — the CTA.
Your CTA
By the time results are fully revealed, hopefully, you’ve driven the argument home and it’s time to encourage audience engagement. How you’ll do it depends on the presentation type and objective. For example, a medical case study could conclude with a CTA that urges viewers to learn more about the research or explore other, relevant studies. Meanwhile, a business presentation could invite viewers to request a demo or a consultation.
If you like, you can wrap this portion of the presentation up with a Q&A session — your audience may want to learn more about the information you’ve shared in the CTA.
How the elements may change depending on the case study presentation type
The essential elements above apply to business and marketing case studies but would change slightly for other presentation types. For example, in a scientific case study, the “Problem” would be replaced by the “Hypothesis,” and the “Solution” component would likely give way to the “Method.” Likewise, a medical case study would focus on a patient’s condition and prognosis (problem), the treatment they received (the solution), and the outcome along with the updated prognosis (results).
How to structure a case study presentation for maximum impact
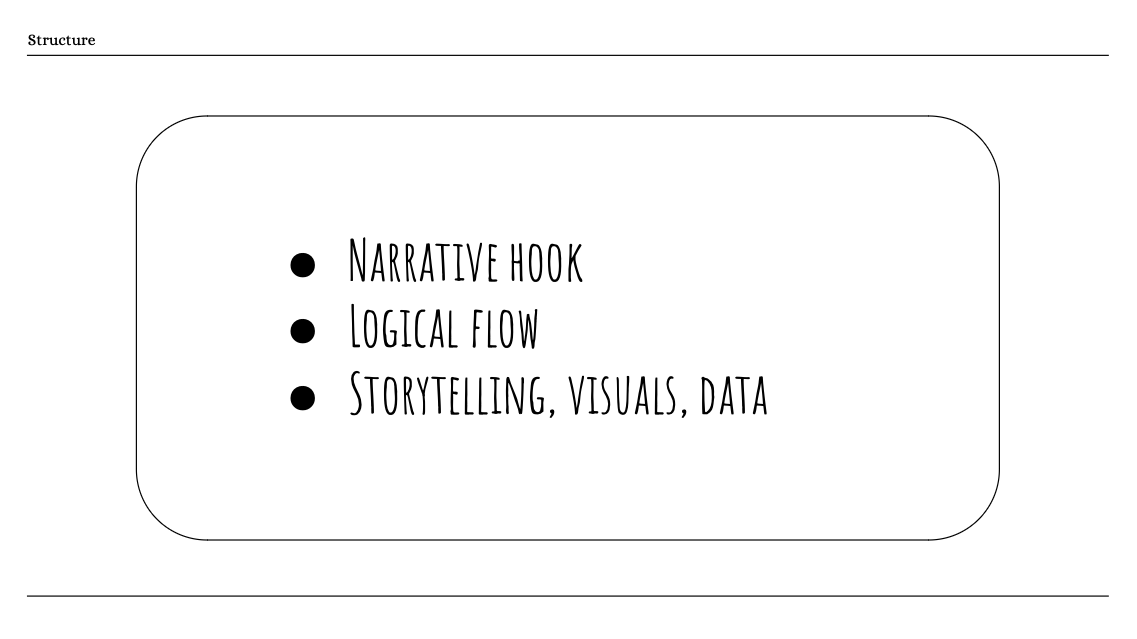
Dedicating parts of the deck to the five elements discussed above will help you deliver your message in its entirety. But if you want this message to have a lasting impact on the viewers, you must connect these elements together in a cohesive manner. Here’s how:
- Start off with a narrative hook
- Ensure logical flow within and between slides
- Balance your use of storytelling, raw data, and visuals
Start with a narrative hook
Case studies lend themselves perfectly to storytelling since they inherently comprise most elements of a good story, including the central character (the stakeholder), the conflict (the problem), the journey (the solution), and the resolution (the solution). Take advantage of this innate structure and kick off the case study with an effective narrative hook that draws the audience in right away.
Let’s look at an example narrative hook for an environmental case study. A small nonprofit focused on providing clean potable water in remote communities suddenly came upon an unexpected challenge — local authorities revoked their permits to build a major well. With the community’s water sources depleting rapidly due to ongoing droughts, this regulatory snag threatened to cause major harm to the inhabitants. The project manager, Sarah, had to look for creative solutions to overcome the crisis. Could her nonprofit find a way to deliver potable water to the community in time?
By framing the case study as a narrative, you quickly pique the audience’s interest and build suspense before getting to the essence of the presentation — the solution.
Ensure logical flow
The ideas you convey in a case study presentation should follow a logical sequence, where each topic you bring up organically leads to the next. In practical terms, each slide should be contextually relevant to the one immediately preceding or succeeding it, with as smooth a transition between the two as possible. The last thing you want to do is disrupt the flow of information with a topical tangent that will only confuse your audience and shrink already short attention spans.
Balance storytelling, raw data, and visuals
Whether the intent of a case study presentation is to persuade or inform, your slide deck should strike a balance between the storyline, the raw data you present, and the visuals. These elements are easy enough to weave together.
For example, let’s say you’re presenting a case study on the success of a marketing campaign. You introduce the campaign from the perspective of a small, struggling business, setting the presentation up as a story. While showcasing the “solution,” present side-by-side images of ad creatives that worked well in the campaign versus those that fell flat. Finally, present the before-and-after sales data as a graph to show the effect of the campaign. You can reinforce the message further with videos of customer testimonials.
Designing compelling slides for a case study presentation
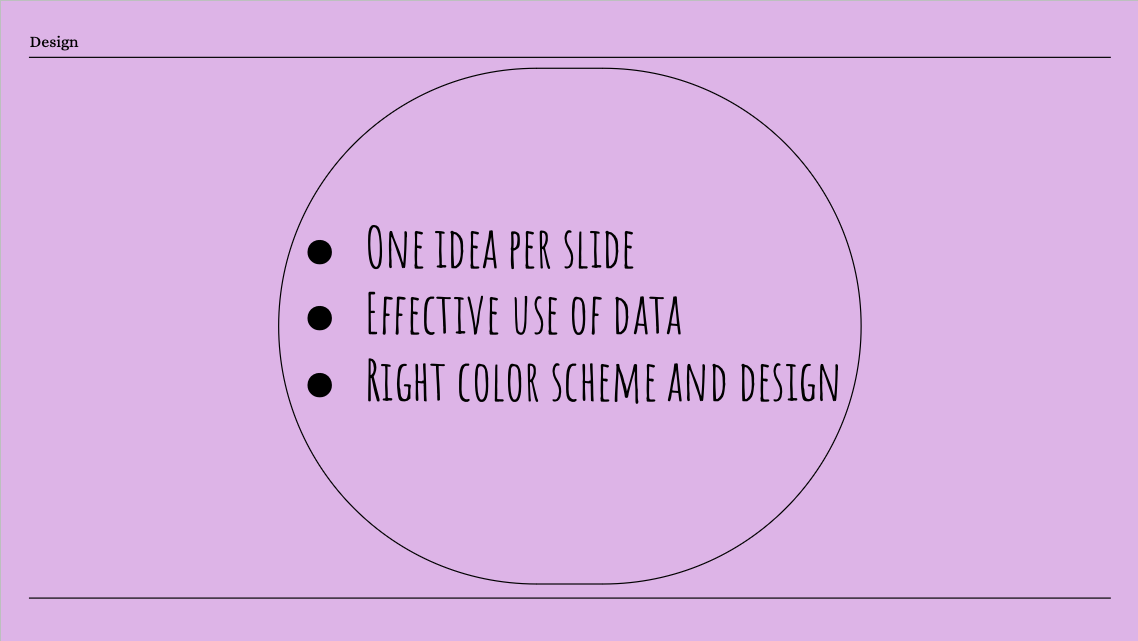
To make your slides powerful and compelling, follow these three simple strategies:
- Present one idea per slide
- Use data effectively
- Choose the right design and color scheme
Present one idea per slide
To keep confusion at bay and avoid firehosing viewers with information, keep each slide to a single topic. This is a generally accepted best practice for all presentation types; even the data-rich consulting decks made by McKinsey and the like stick to this simple principle.
If a slide topic is particularly information-dense, consider using the Pyramid Principle to structure a slide. Like a pyramid, the top of a slide starts with the shortest statement (i.e. the slide title), which conveys the most important takeaway. Directly below the title, the middle portion of the slide comprises supporting arguments for the key takeaway above. Meanwhile, the bottom of the slide is home to evidence that reinforces each of the arguments. Structuring your case study slides according to this principle will make complex ideas easier to digest and improve the logical flow within the slide.
Use data effectively
Whether you’re presenting the “before and after” states, or getting into the details of the “solution,” it can be tempting to inject slides with graphs, charts, spreadsheets, and other media that showcase relevant data points. But if you don’t curate these elements properly, you only risk overwhelming the audience and losing their attention. As the creator of the presentation (and possibly a stakeholder in the case study), you have an inherent bias — all the data already makes sense to you. This is not the case for your viewers, who are absorbing the information for the first time.
So, how do you use data effectively?
For one, pick a graphic type that suits the data. For example, bar graphs are effective at showing the before and after states, whereas a linear chart is useful for presenting changes that occur over time. Depending on the subject matter, schematic diagrams may be appropriate at every stage of the presentation, either showcasing the problem, solution, or results. Images and videos should be used, but sparingly, and only where they’re relevant to the slide content.
Likewise, don’t assume that the viewers will be able to decipher a chart or schematic at a glance. Be sure to label each component, and walk the audience through each part of a graphic before discussing the data in greater detail.
Choose the right design and color scheme
The visual aspect of slide design is easy to overlook if you’re focused on crafting engaging and informative slide content. But failing to create attractive slides can backfire, making your presentation look unprofessional or downright hard to follow visually. Here are a few best practices to follow:
- Choose a limited color palette: Stick to just a few main tones. Neutral tones are well-suited for professional, formal, and minimalistic decks; meanwhile, bolder colors might work if you’re presenting a creative solution (or highlighting key parts of a presentation). If you’re unsure, you can always align the palette with your brand. Crucially, keep your color choices consistent throughout the deck.
- Keep it clean: While creative visual designs can add some much-needed zest to a presentation, overwhelming patterns and busy backgrounds are distracting. Keep the slides clean and laser-focused on the data.
- Ensure contrast: The text should contrast enough with the background color to be legible. That said, high contrast is often as illegible as poor contrast, especially for viewers who are color-blind. For example, scarlet text on a lime green background is as hard on the eyes as light tan on a white background.
Create a case study presentation quickly and efficiently with AI
Putting together a quality case study presentation requires a good deal of effort — much of which should be focused on crafting content that delivers a strong message. However, tedious tasks like outlining, slide design, and even translating data points into text or visuals can distract you from refining the content and practicing delivery. Fortunately, you can streamline all of these laborious, often boring, and always necessary activities with the power of AI.
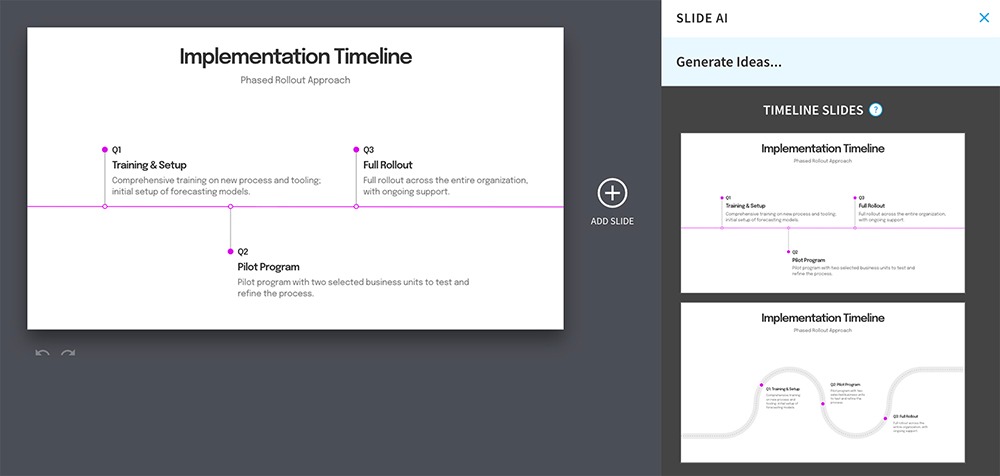
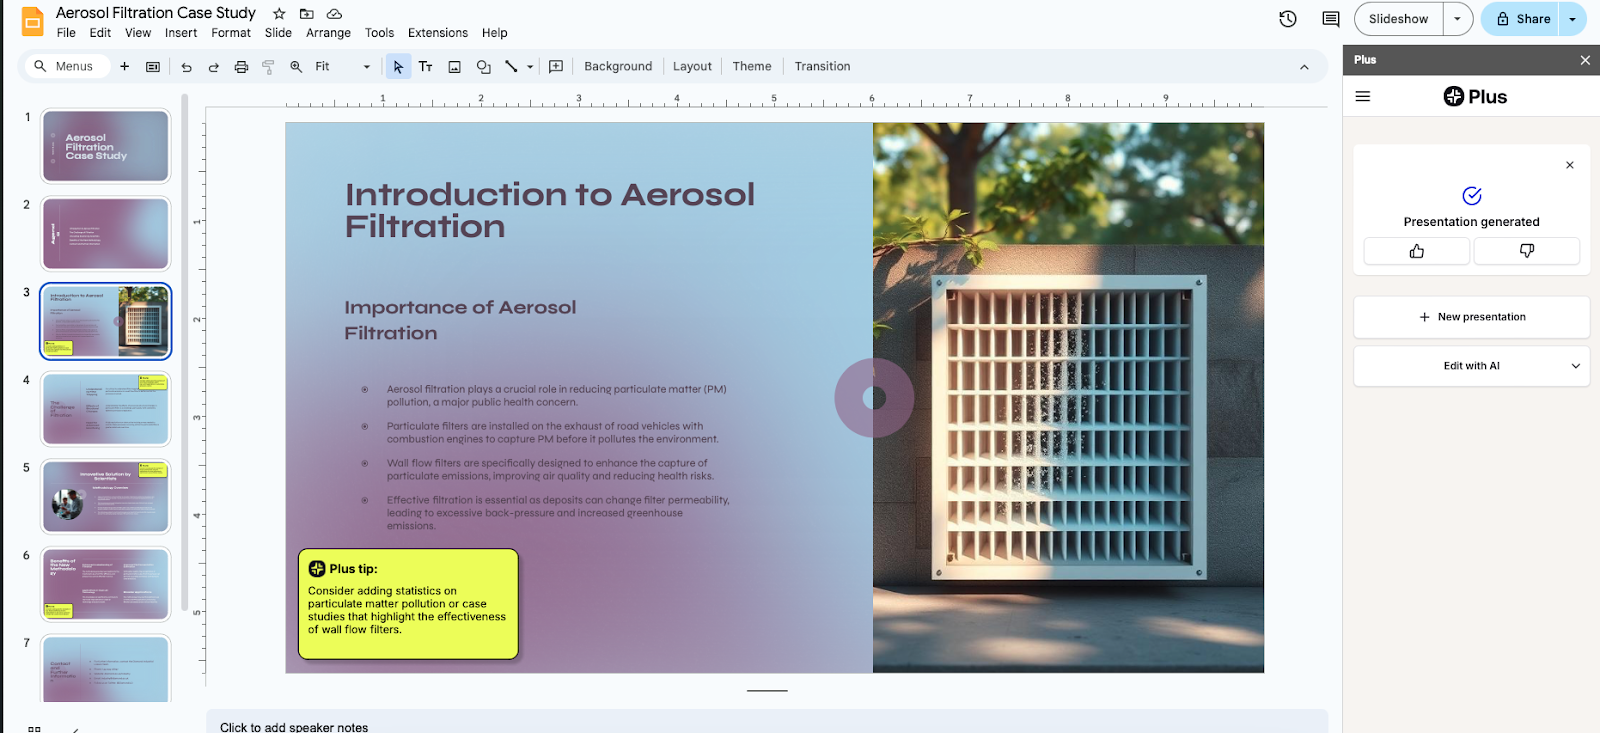
For example, using Plus AI, you can overcome the first blank slide and get your case study transposed to a deck in minutes using one of these three methods:
- By uploading a document: This approach works well if your case study materials are consolidated in a file. Plus AI will process the file and convert the information into a slide deck, complete with content and visuals.
- By entering a prompt: If you’re not sure where to start, enter the presentation topic and describe the case study in a prompt. Plus AI’s prompt window allows you to enter roughly ~20,000 words, so be as detailed as you like. That said, even a short description will get you an outline and an auto-generated deck you can tweak and refine to your heart’s content.
- By prompting slides individually: If you’ve already outlined the presentation structure and need help writing content, enter prompts for each slide one by one.
Regardless of the chosen method, Plus AI will generate a deck that’s as info-rich as it is elegant and professional. You’ll even have access to a suite of AI editing tools that make revisions a breeze. By delegating the bulk of the slide-creation process to the AI model, you’ll leave yourself more time to tailor the message and delivery.
How to use Plus AI to create a case study presentation
If you’re working on a case study presentation, chances are that all your source materials are (or can be) in a file. If that’s the case, use these steps to auto-generate a presentation with Plus AI:
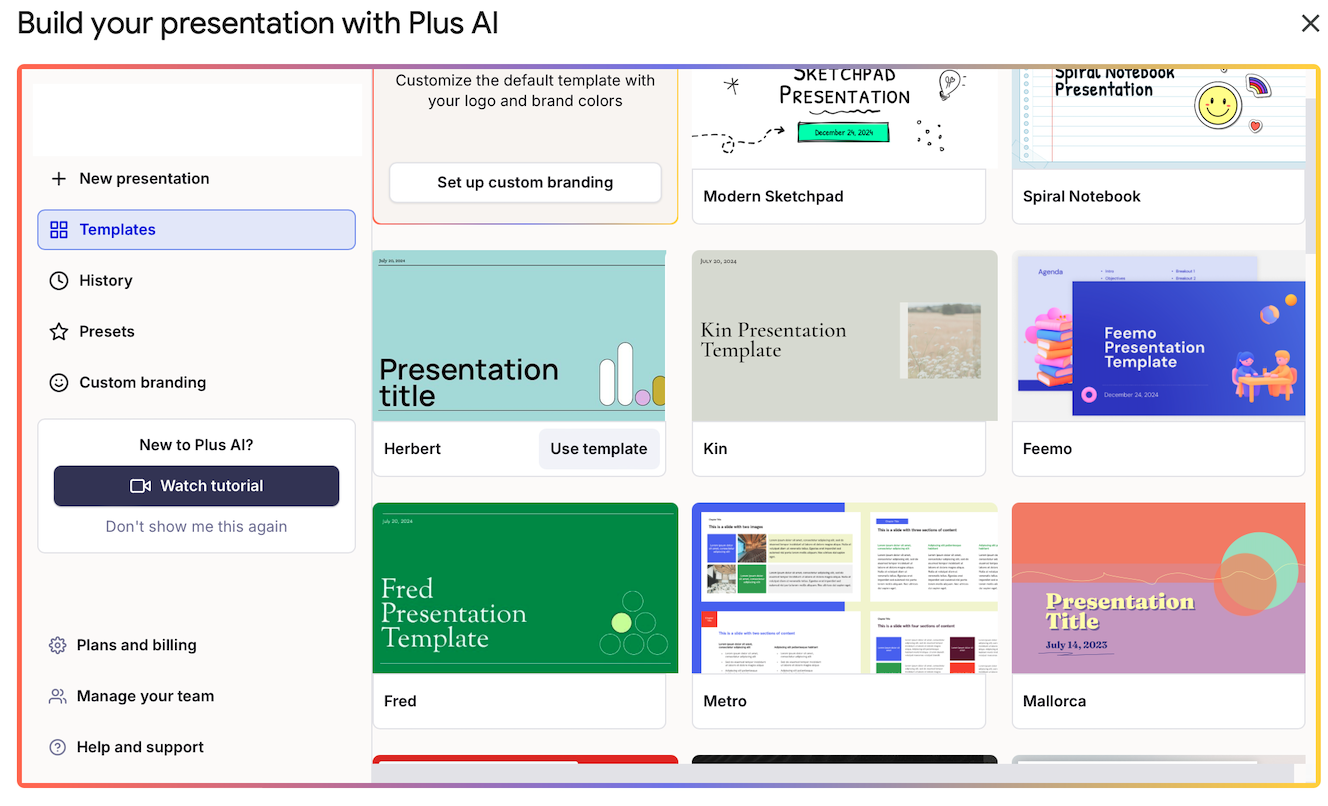
- Find the Plus AI extension, then choose “New presentation with Plus AI” from the dropdown menu.

- Find a color scheme you like. In the catalog, browse through the available templates, hovering your cursor over each one to see how the individual slides will look in the deck. Click on the one you like.
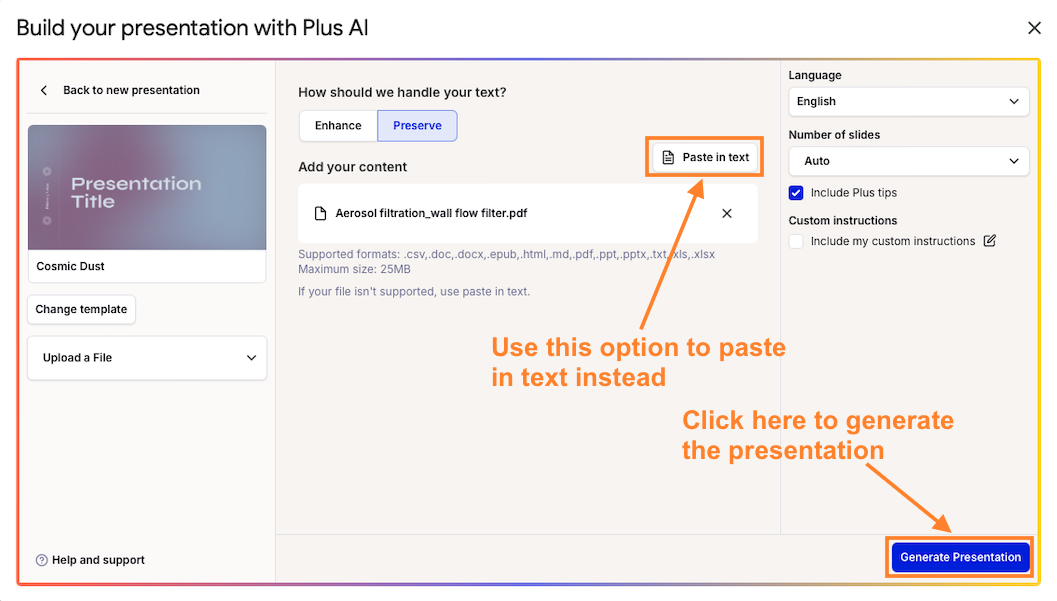
- Click on the “Upload a file” button.
- Browse your computer and select the file with the case study. If your materials are scattered between several documents, copy-paste the relevant bits into the prompt window instead. Click “Generate slides” when ready.
- Flip through the auto-generated slide deck. Make any changes you like either manually or using Plus AI’s editing tools. For example, you can remix slide content, generate new images, or add a brand-new slide.
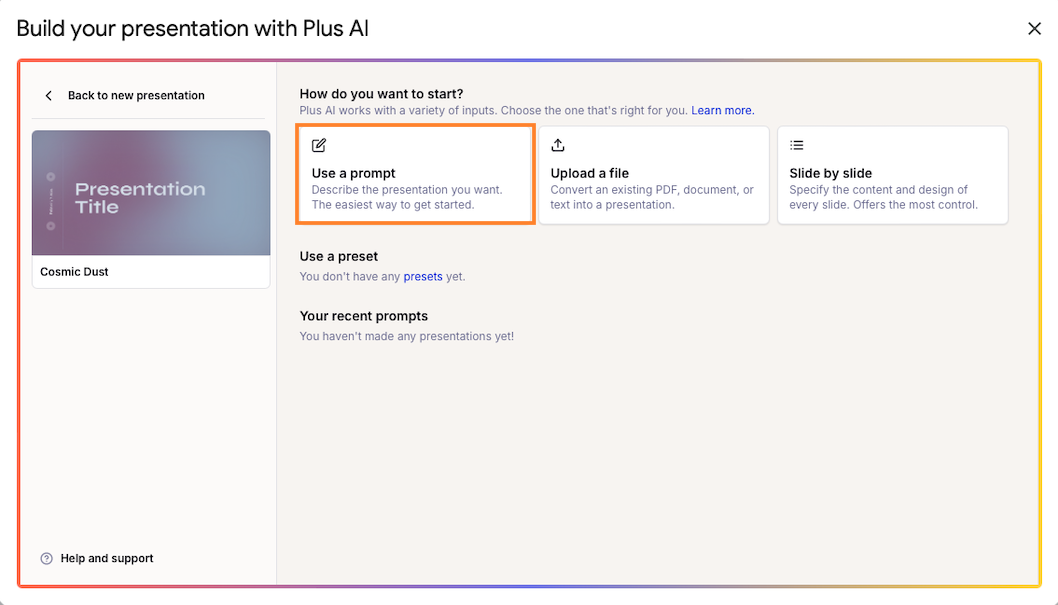
The presentation-from-a-prompt and slide-by-slide tools are just as easy to use. Once you’ve selected a suitable template, pick one of these two functions, then:
- If using prompt-to-presentation: Describe the case study in as much detail as possible, review and revise the outline Plus AI will produce, and click on “Generate Slides” to get your deck.
- If using slide-by-slide: Set up the presentation outline by inputting the slide titles and prompts individually. Then click on “Generate Slides”.
Tips for delivering a compelling case study presentation
It’s always good to brush up on delivery skills before you have to face the audience, and our guide to giving killer presentations will help you in this regard. But here are a few more tips tailored specifically to case study presentations:
- Own the problem: Elicit empathy from the audience by speaking about the problem as if you’ve personally experienced it (you don’t have to say that you did, of course).
- Get the stakeholders to participate: If any of the stakeholders are present, get them to opine on either the problem, the solution, or the results, and share their experiences with the audience.
- Address skepticism proactively: If the results of the case study are surprising, be ready to face doubts from your viewers. However, don’t wait for a Q&A session to take questions from your skeptics. Instead, anticipate their concerns or queries in advance, and dispel any doubts as you present the results.
- Loop the audience into the discussion of the results: Engage your viewers by asking them how the solution could be useful in tackling their challenges.
Case study presentation FAQs
What are the 5 components of a case study?
- The problem: The case study will showcase the method(s) used to resolve this issue in the real world.
- The stakeholders: These are the people or organizations who were involved in any aspect of the case study.
- The solution: This is the method that resolves the problem in your case study.
- The results: This is the final outcome of applying the method to the problem you’ve set out to solve. Usually, case study presentations include a “before and after” comparison at this stage.
- The call to action: This is the recommendation you’re making to your viewers. Its nature will depend on the subject matter.
How do you present a case study creatively?
To present a case study creatively, frame it as a story revolving around the problem, the solution, and the central stakeholders. This should be easy enough since case studies are well suited for the narrative format — in essence, a case study is a story. Likewise, try your best to use visual formats to showcase the various elements of the study instead of presenting raw data.
Apart from the above, consider presenting testimonials from people involved in the study and including interactive features, like live polls and brainstorming sessions.
How long should a case study presentation be?
The ideal length of a case study presentation depends on the complexity of the subject matter. That said, such presentations typically last up to 30 minutes, including the Q&A portion at the end.