
Resources
How to create a bar chart in PowerPoint

As you know, slideshow presentations are visual tools for conveying a message to an audience. While they can, of course, include text, it’s the graphics, charts, illustrations, and photos that make a presentation pop.
If you have comparison data that you want to show your audience, you can easily create a bar chart in PowerPoint. We’ll walk you through using PowerPoint’s chart tool on Windows and Mac, and also how to insert a bar chart slide with the Plus AI PowerPoint add-in.
Add a bar chart using AI
If you want to add a simple graph that’s pre-formatted and includes highlights of the data, you can use Plus AI to insert a slide with a chart.
With your presentation open in PowerPoint, follow these steps:
- Go to the Home tab and pick Plus AI.
- Select Edit with AI and choose Insert.
- Add a Slide title and Description.
- Pick the Charts Layout and choose the bar chart slide.
- Click Generate Slide.
You can then select the chart and use the Chart Design and Format tabs to adjust the bar chart as described earlier.
Plus works with Microsoft PowerPoint and Google Slides to generate entire presentations or individual slides for existing presentations using AI. You can also rewrite content or remix slide layouts with simple prompts.
Visit Plus AI for additional details, features, and to start your free trial.
Insert a bar chart in PowerPoint
PowerPoint offers a built-in feature for adding a variety of different chart types. For bar charts specifically, you can insert one that’s clustered, stacked, 2D, or 3D to display your data. The process for adding a bar chart is slightly different in PowerPoint on Windows versus Mac.
On Windows, select a slide and follow these steps:
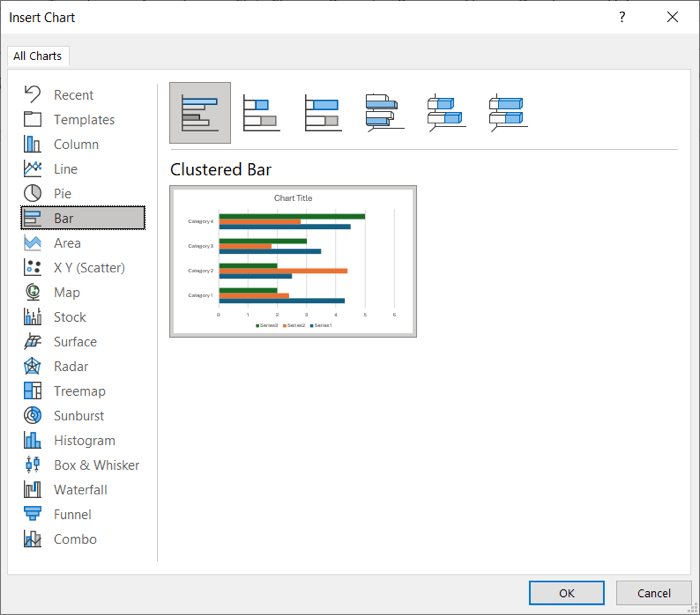
- Go to the Insert tab and select Chart in the Illustrations section of the ribbon.
- Choose Bar on the left and then pick a style on the right.
- Click OK to add the chart to the slide.
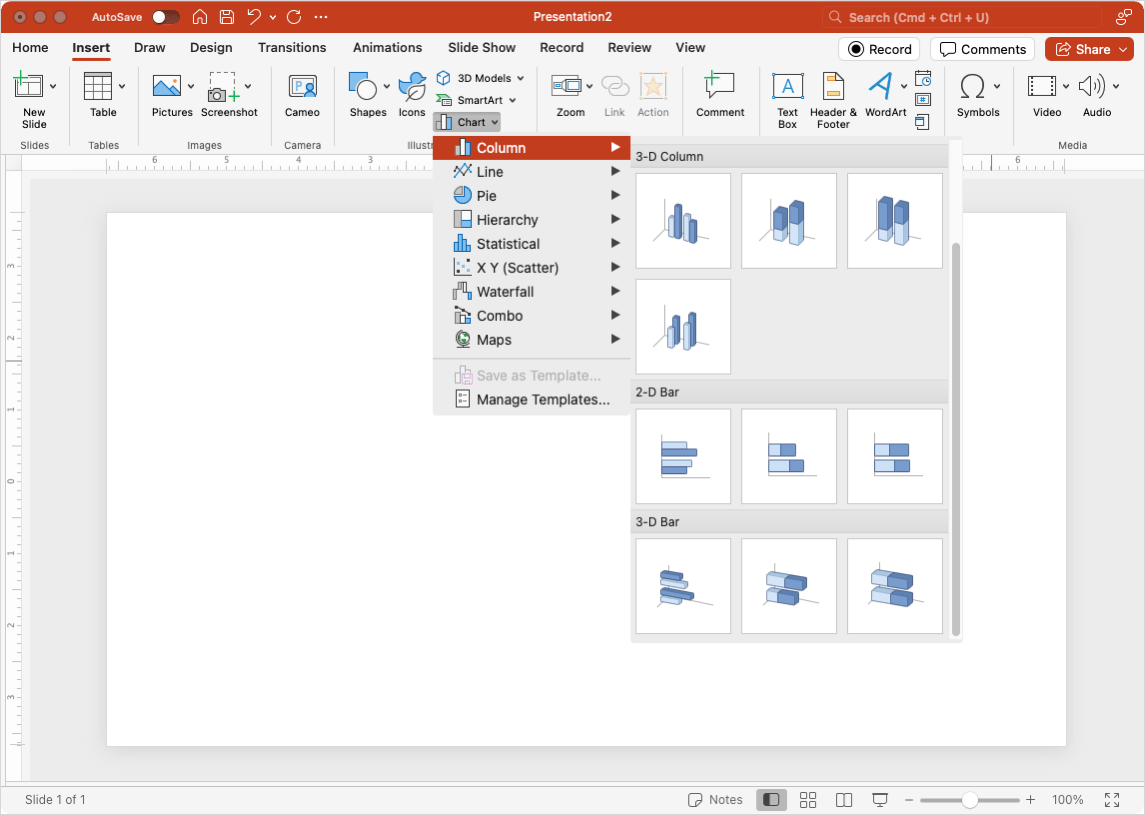
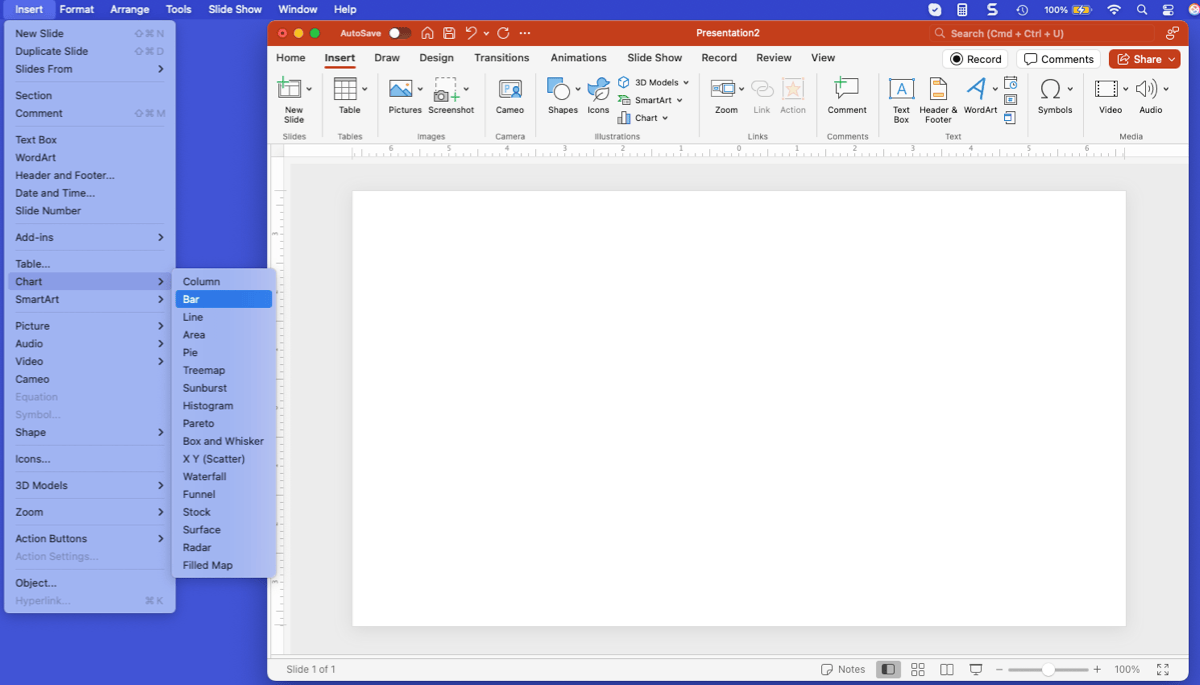
On Mac, select a slide and do one of the following:
- Go to the Insert tab and open the Chart menu. Move to Column and pick a bar chart style at the bottom.
- Go to Insert in the menu bar, move to Chart, and select Bar in the pop-out menu.
Tip: If you want to switch to a different bar chart type after you insert it, head to the Chart Design tab and choose Change Chart Type.
Edit the chart data in PowerPoint
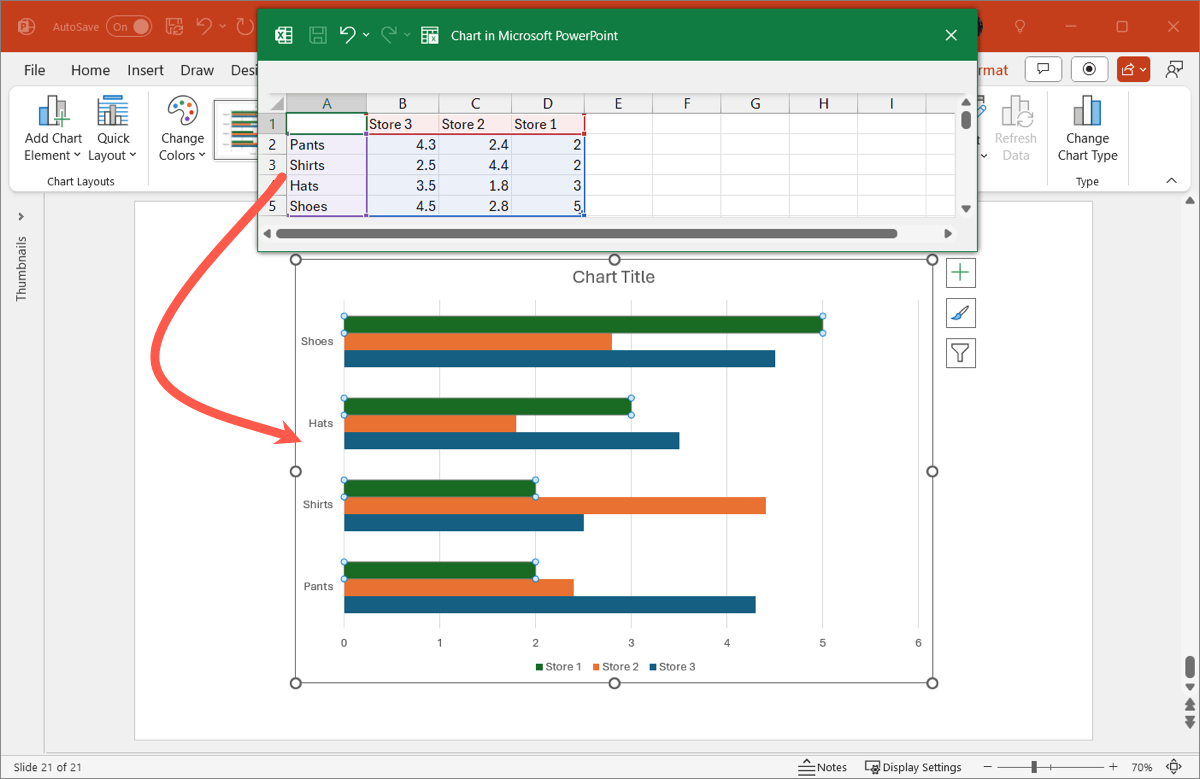
After you insert the bar chart in PowerPoint on either platform, you’ll see an Excel spreadsheet open at the same time. This is the source for the data in the bar chart.
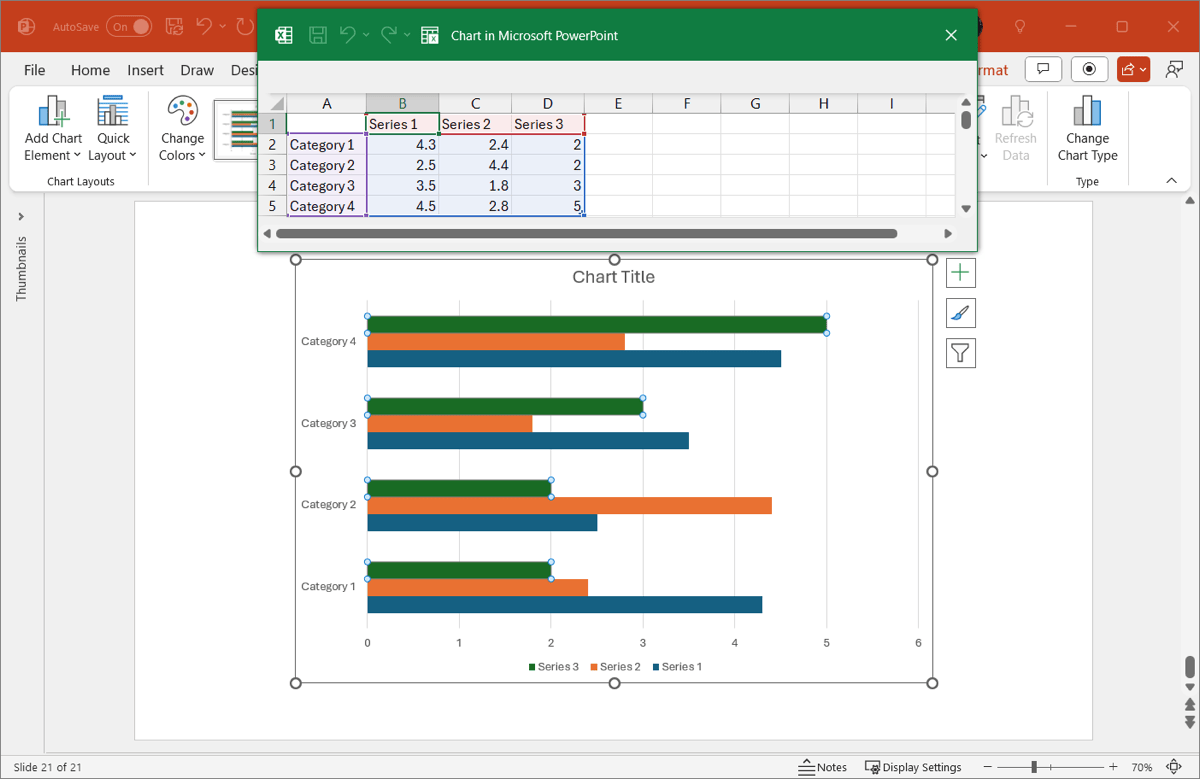
So, as you make changes to the data, you’ll see the bar chart update in real-time.
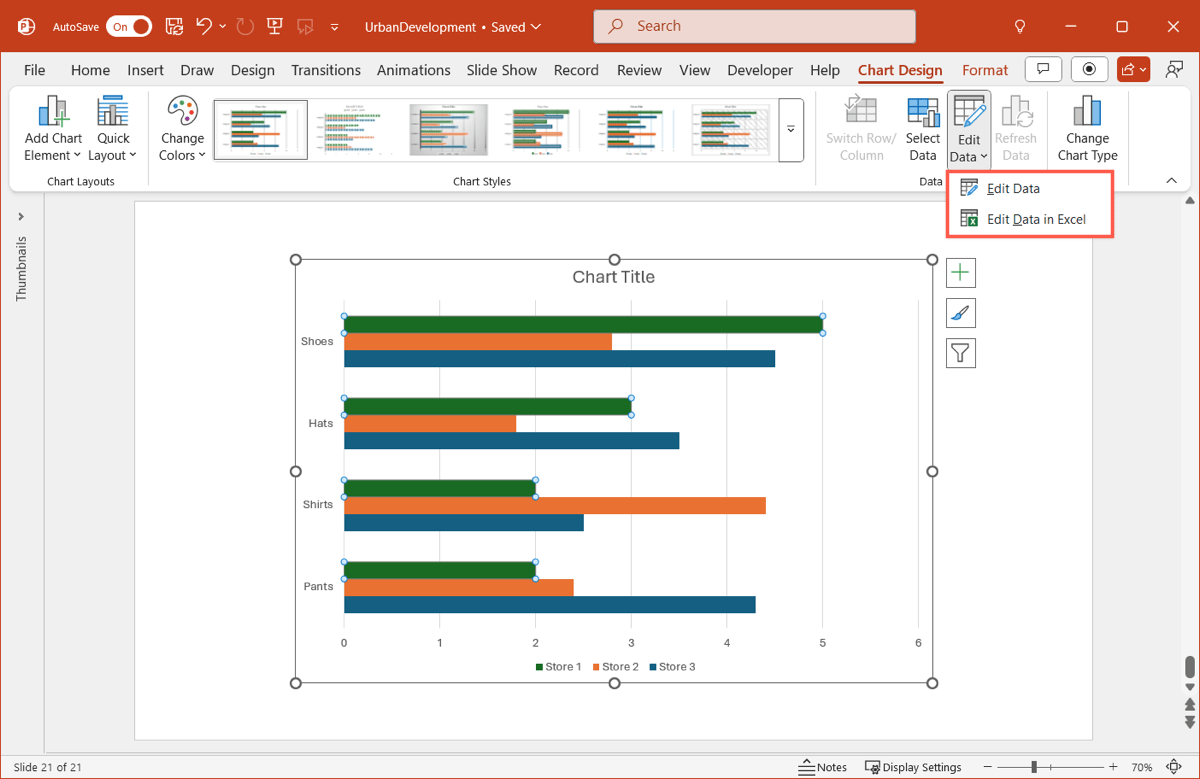
If you close the Excel sheet and need to reopen it, select the chart, go to the Chart Design tab, and click Edit Data or Edit Data in Excel in the ribbon.
Format a bar chart in PowerPoint
Much like other visuals you can add to slides in PowerPoint, you have a variety of options for formatting your bar chart. This includes everything from the layout to the color scheme to the chart elements.
Chart Design tab
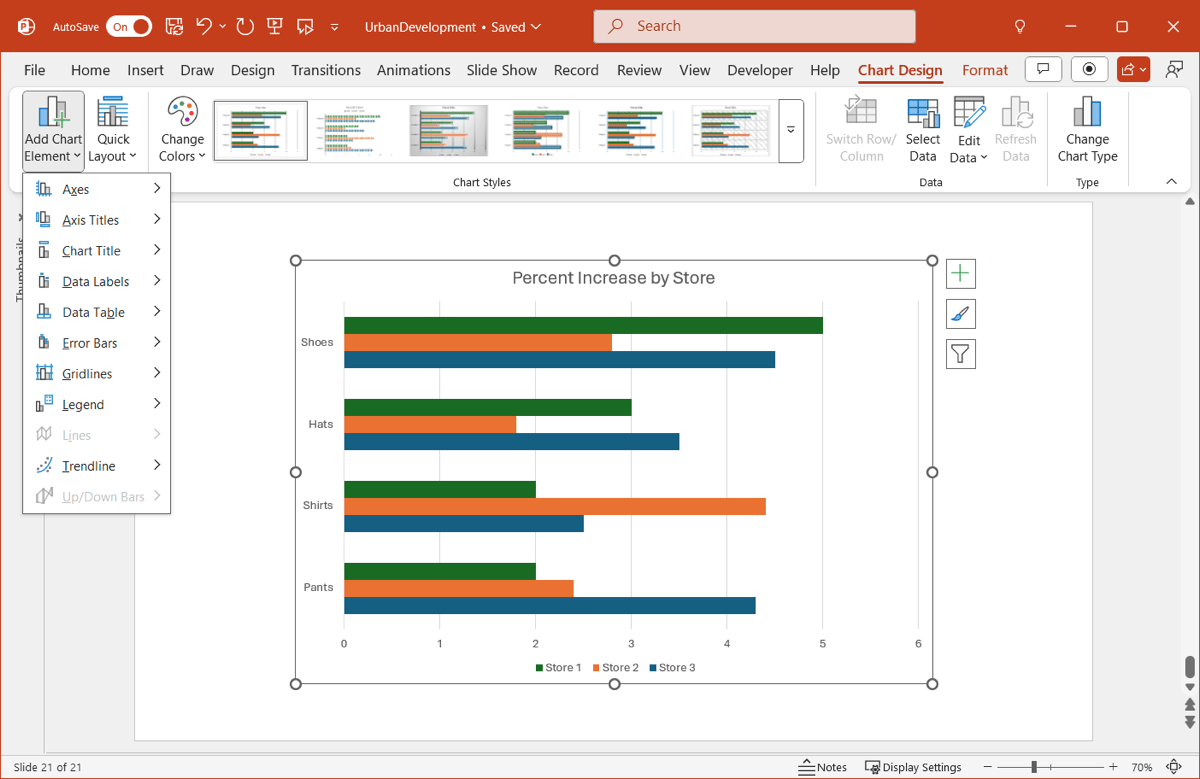
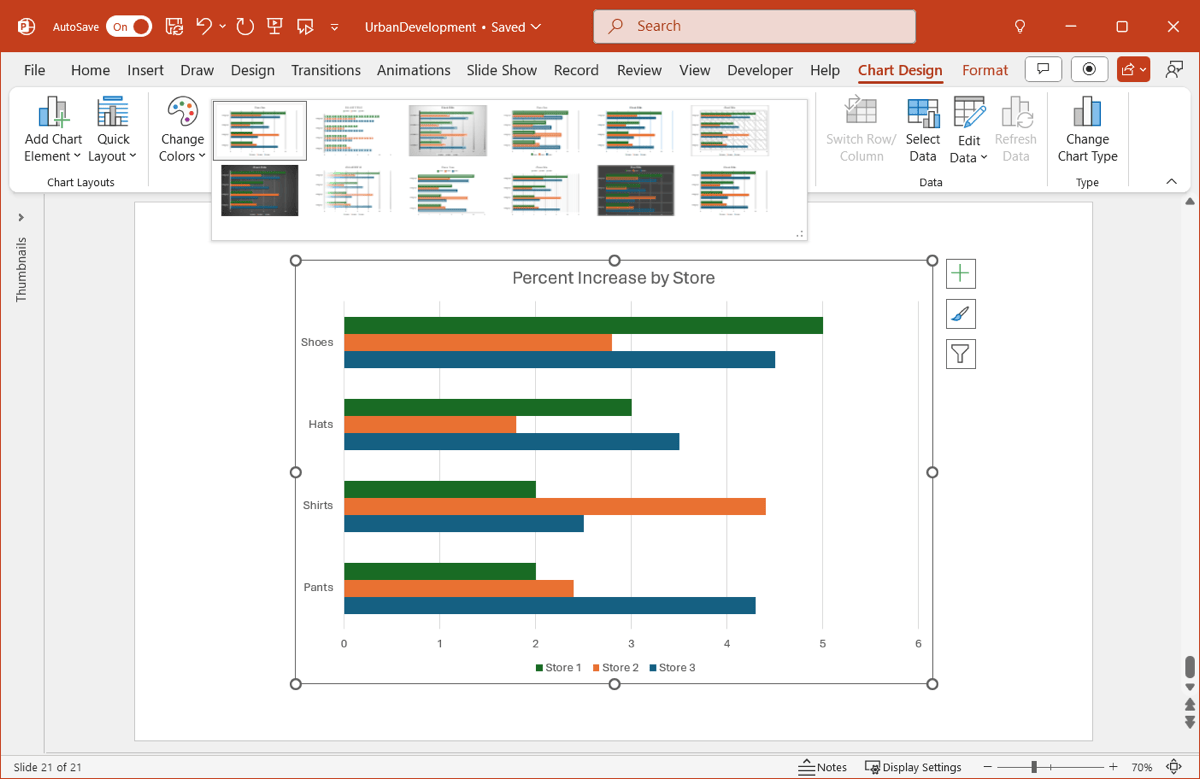
To add items to the chart or edit existing elements, change the layout or color scheme, or apply a style, go to the Chart Design tab.
On the left side of the ribbon is the Chart Layouts section. Open the Add Chart Element menu to adjust the axes, titles, legend, gridline, and other items or the Quick Layout menu to choose a different layout.
In the Chart Styles section, you can pick a different color scheme or apply an attractive style to the chart.
Format tab
To customize the chart area or each series, head to the Format tab.
On the left side of the ribbon, you can use the Chart Area drop-down menu to work with a specific area of the chart. For example, if you want to change the appearance of a certain series, select it in the menu and then make your changes using the other ribbon sections.
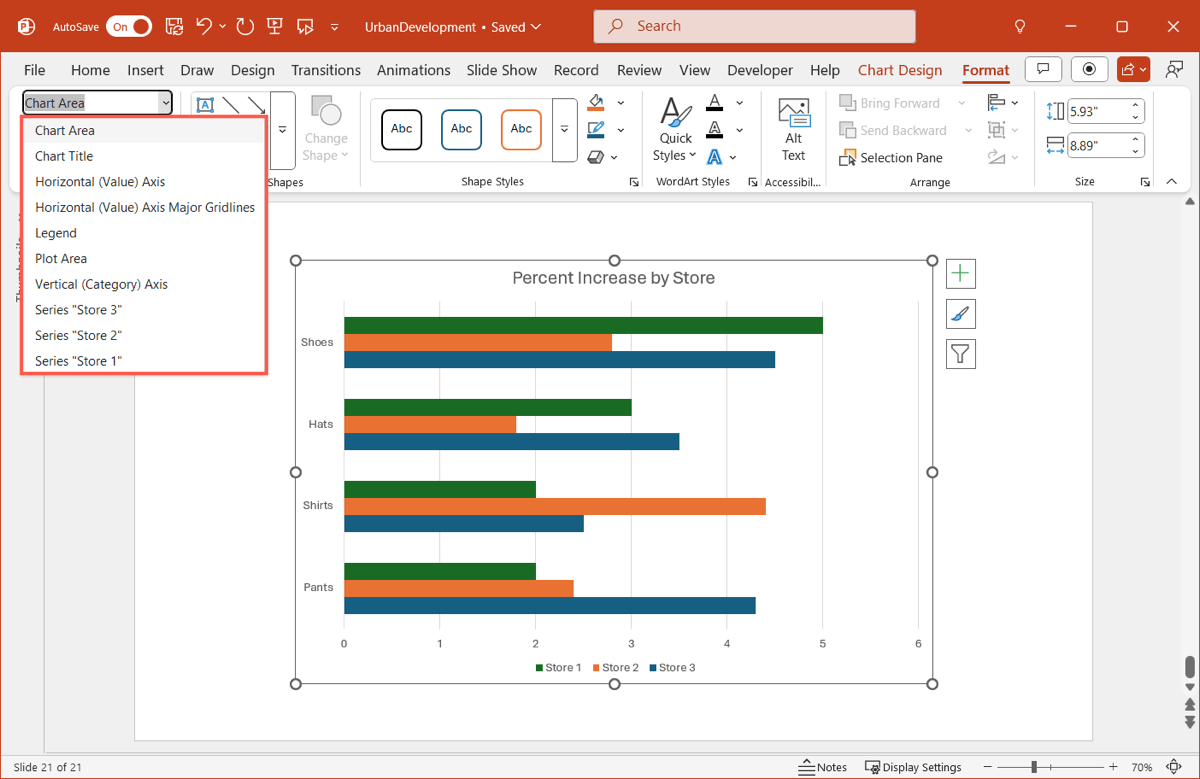
Notice that you can edit the colors, outlines, effects, and fills for the shapes and text. Just make sure to choose the Chart Area you want to adjust before making your edits.
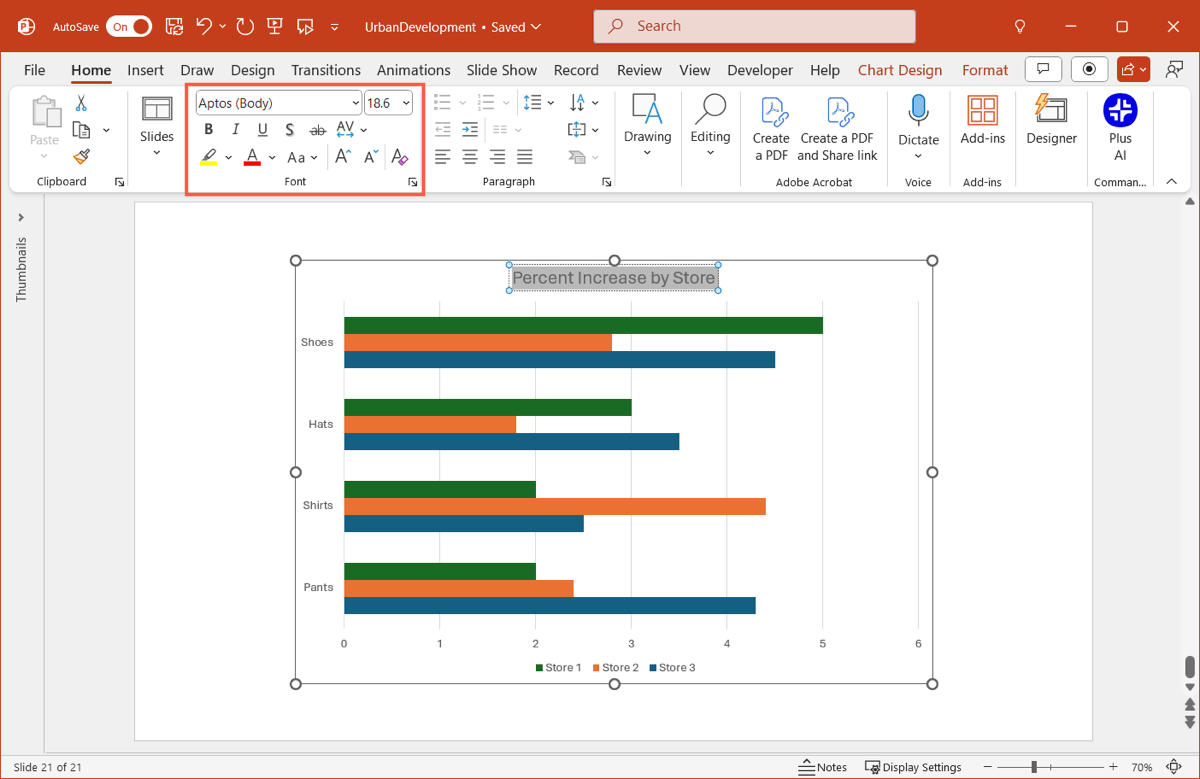
If you want to change the font styles or sizes, select the text on the chart, go to the Home tab, and use the Font section of the ribbon.
Floating toolbar on Windows
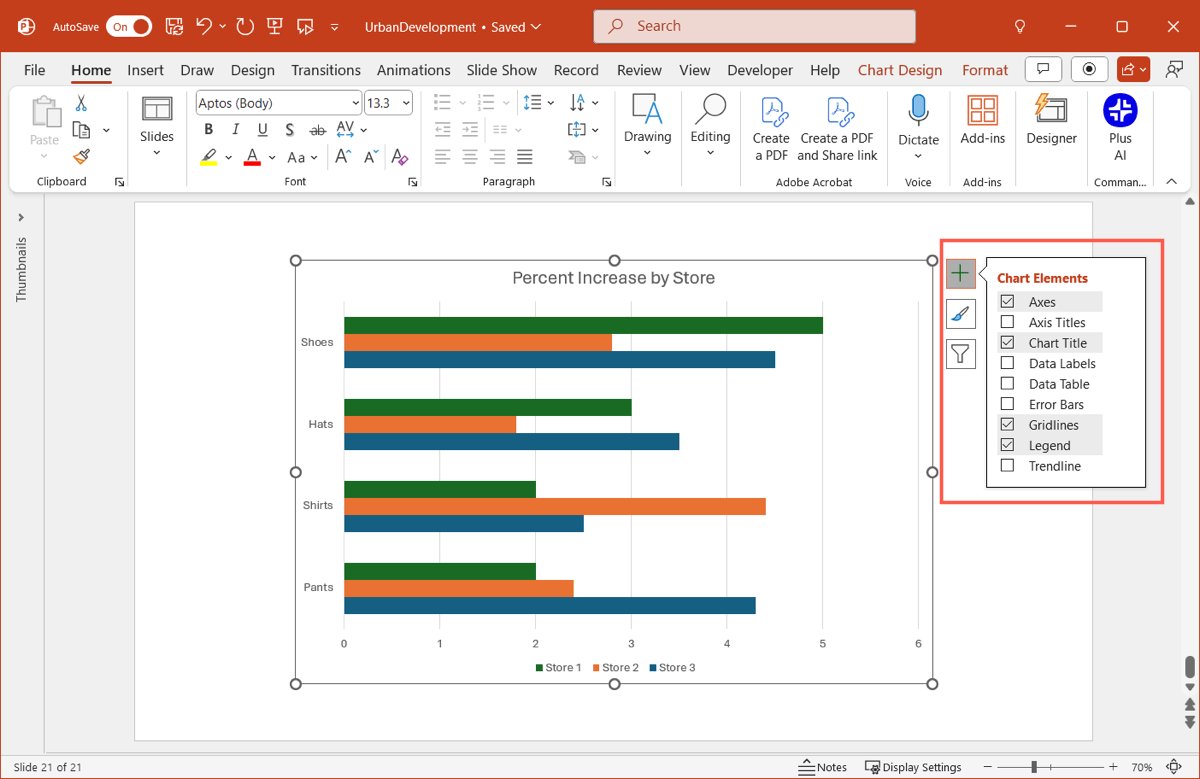
If you’re using PowerPoint on Windows, you’ll notice a floating toolbar on the right side of your chart. This gives you a few quick ways to make changes to the chart.
Chart Elements: Add, remove, or edit elements like titles, gridlines, and the legend.
Chart Styles: Choose a new chart Style or Color scheme.
Chart Filters: Filter the data displayed on the chart using the Values and Names tabs.
Conclusion
Using a chart to display data is the ideal way to convey it visually. Most graphs can speak for themselves, so be sure to take advantage of this data-centric tool for your next presentation.
And remember that Plus AI can help you create and edit slideshows to make them more interesting, engaging, and attractive to your audience.
FAQs
How do you make a bar graph on Slides?
You can make a bar chart in Google Slides by opening the Insert menu, moving to Chart, and picking Bar in the pop-out menu. Then, replace the sample data with your own.
How do you make a chart look good in PowerPoint?
Making a chart look good in PowerPoint includes things like using colors that are easy on the eyes, but useful for displaying the data, adding a meaningful chart title, and not overcomplicating the chart with unnecessary elements. Keep in mind that this is a visual representation of data and should be able to convey that data on its own.
What’s the difference between a pie chart and a bar chart?
A pie chart is useful for showing parts of a whole whereas a bar chart is useful for showing comparisons and differences in categories. As examples, you might use a pie chart to show how the amounts of your expenses add up to your monthly budget, but you would use a bar chart to show the differences in sales for products by store.
META DESC:
Need a nice visual for your data? Here’s how to create a bar chart in PowerPoint on Windows and Mac.
WORDS: 1093