
Plus AI-Funktion
KI-Bildgenerator für Präsentationen
Generieren Sie KI-Bilder für PowerPoint- und Google Slides-Präsentationen.

Passen Sie Ihre Folien mit KI-Bildern an
-
Generieren
Erstellen Sie automatisch KI-Bilder für Präsentationen, wenn Sie mit Plus ein neues Foliendeck generieren.
-
Einfügen
Fügen Sie KI-Fotos und Illustrationen zu vorhandenen Folien hinzu. Verwenden Sie unsere Stilvorgaben oder probieren Sie Ihre eigene Aufforderung aus.
-
Experimentieren
Erstelle ein Moodboard, überlege dir neue Konzepte oder visualisiere Ideen mit KI-Bildern.
Einfach zu bedienende AI-Bildstile
Menschliche Kreativität, KI ermöglicht.
Sie müssen kein Prompt-Genie sein, um unseren Bildgenerator zu verwenden — beschreiben Sie einfach, was Sie sehen möchten.
-
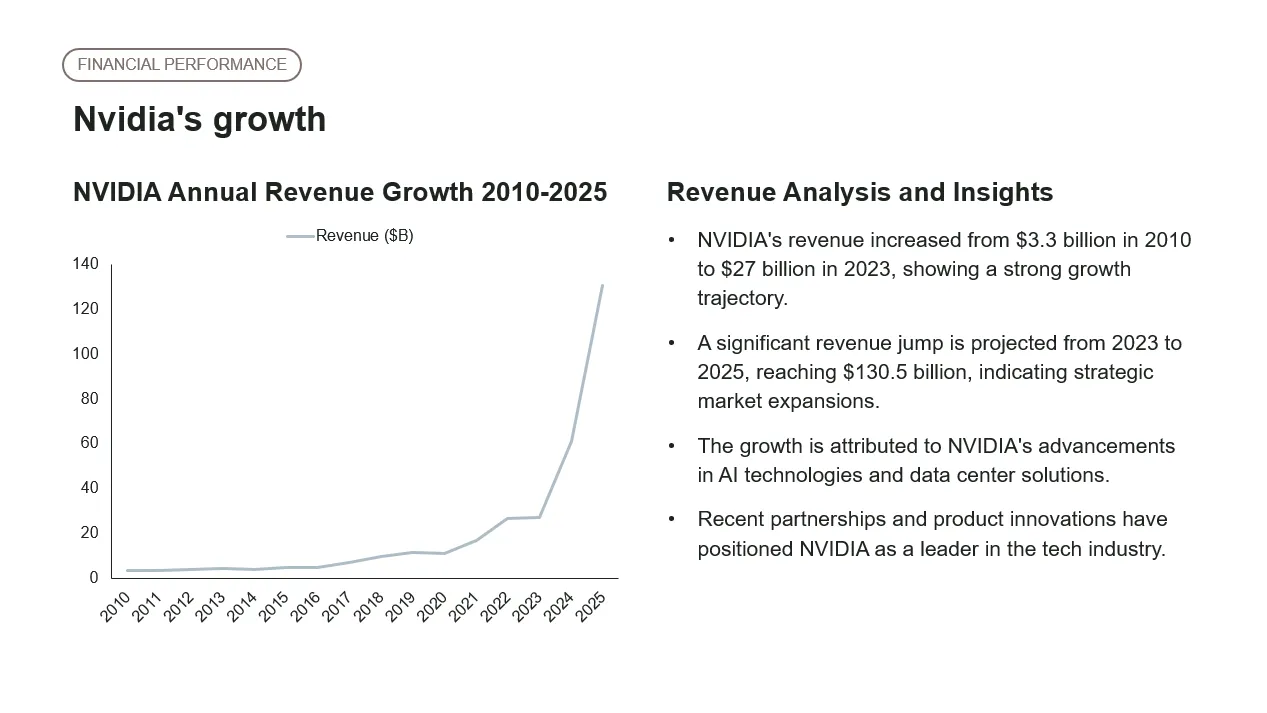
Business analytics and reporting
"analyze Nvidia's growth from 2010 to 2025" — "compare actuals vs budget for the last 5 quarters"
-
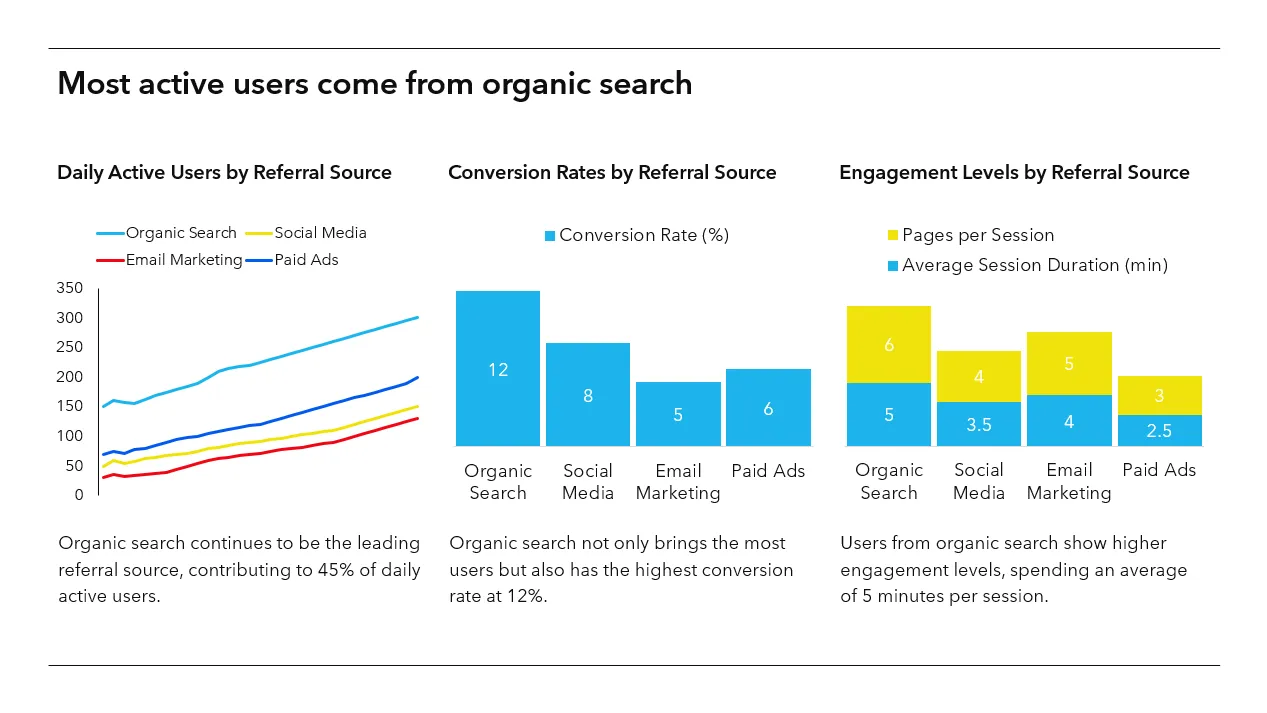
User behavior and insights
"overview of daily active users by referral source" — "most popular features for paid users"
-
Education and instruction
"gravitational constant for each planet in the solar system" — "energy produced from renewable sources vs. others"
-
Creative visualizations
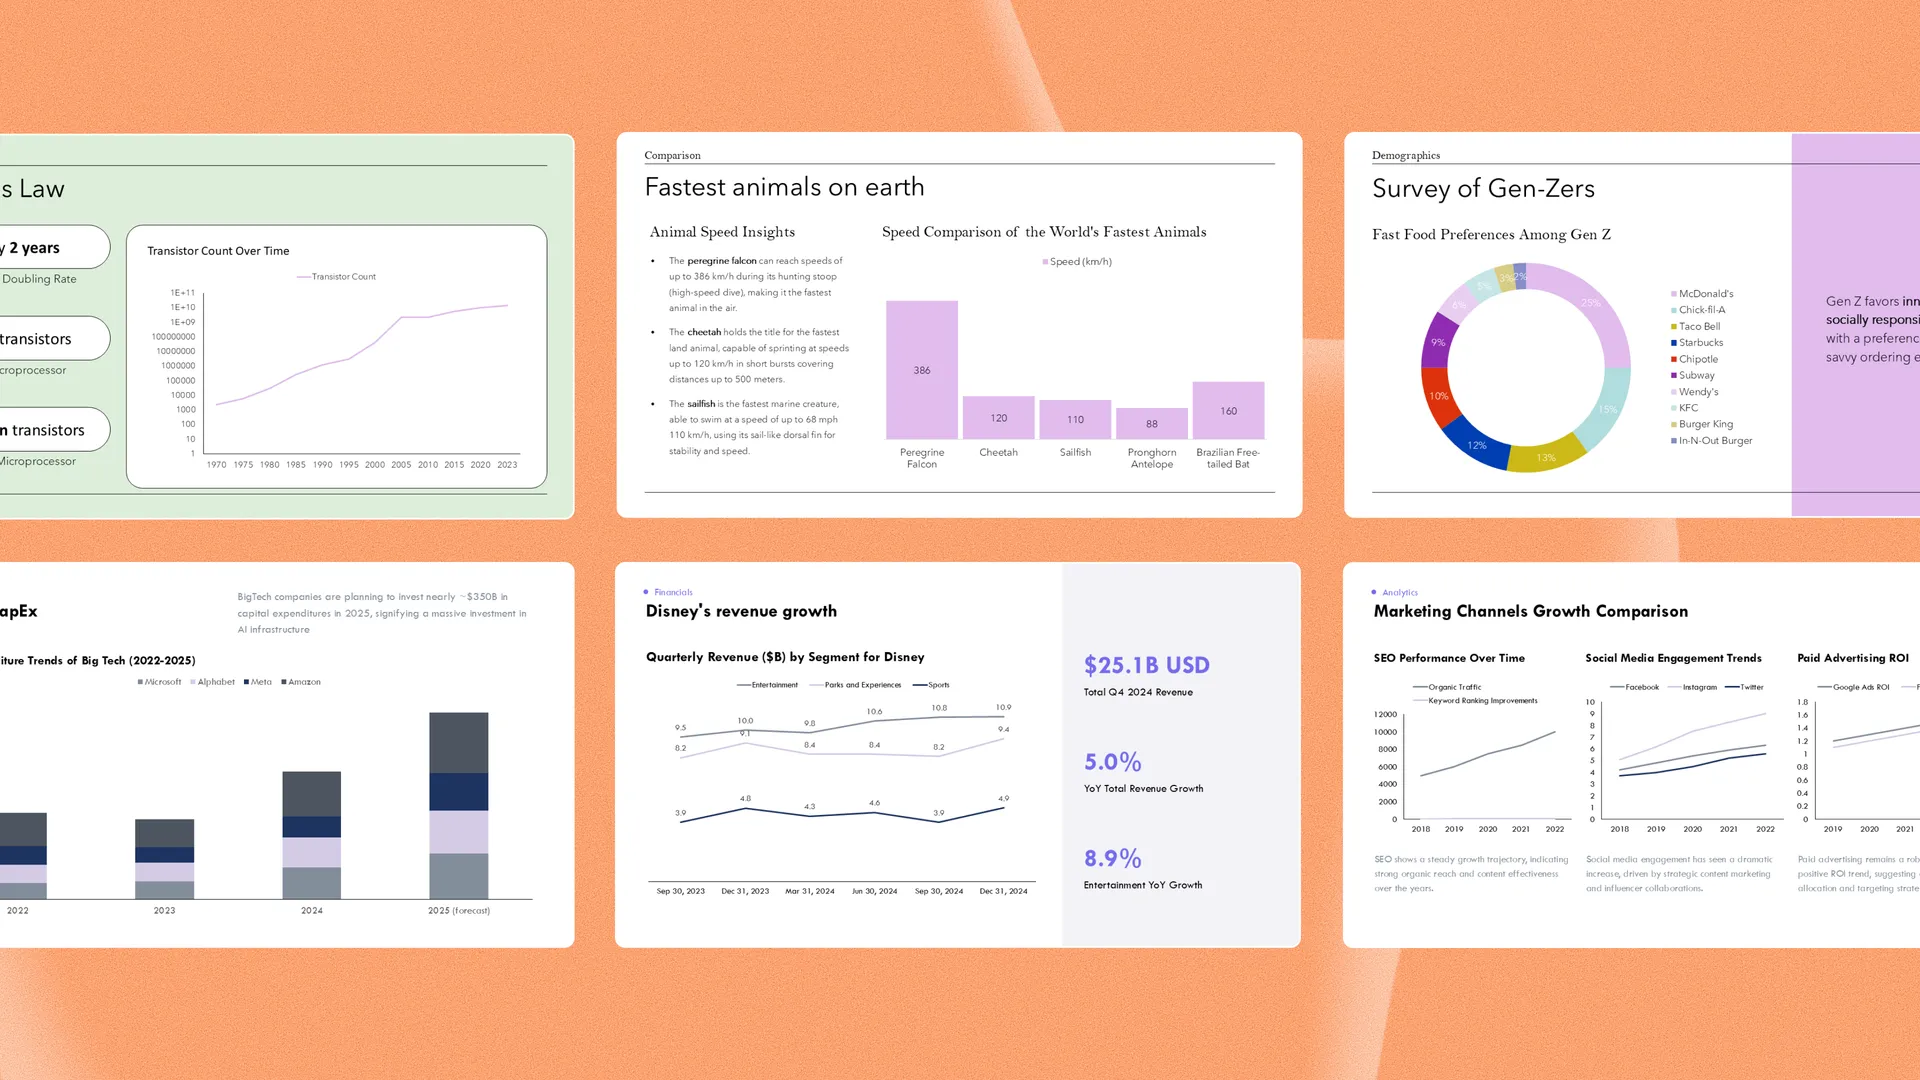
"most popular fast food franchises for Gen Z consumers" — "top 10 largest zoos in the United States"
More Plus AI features
-
Generate with AI
Don't know where to start? Just describe your presentation in a few sentences.
-
Datei hochladen
Convert an existing PDF, document, or text file into a custom presentation.
-
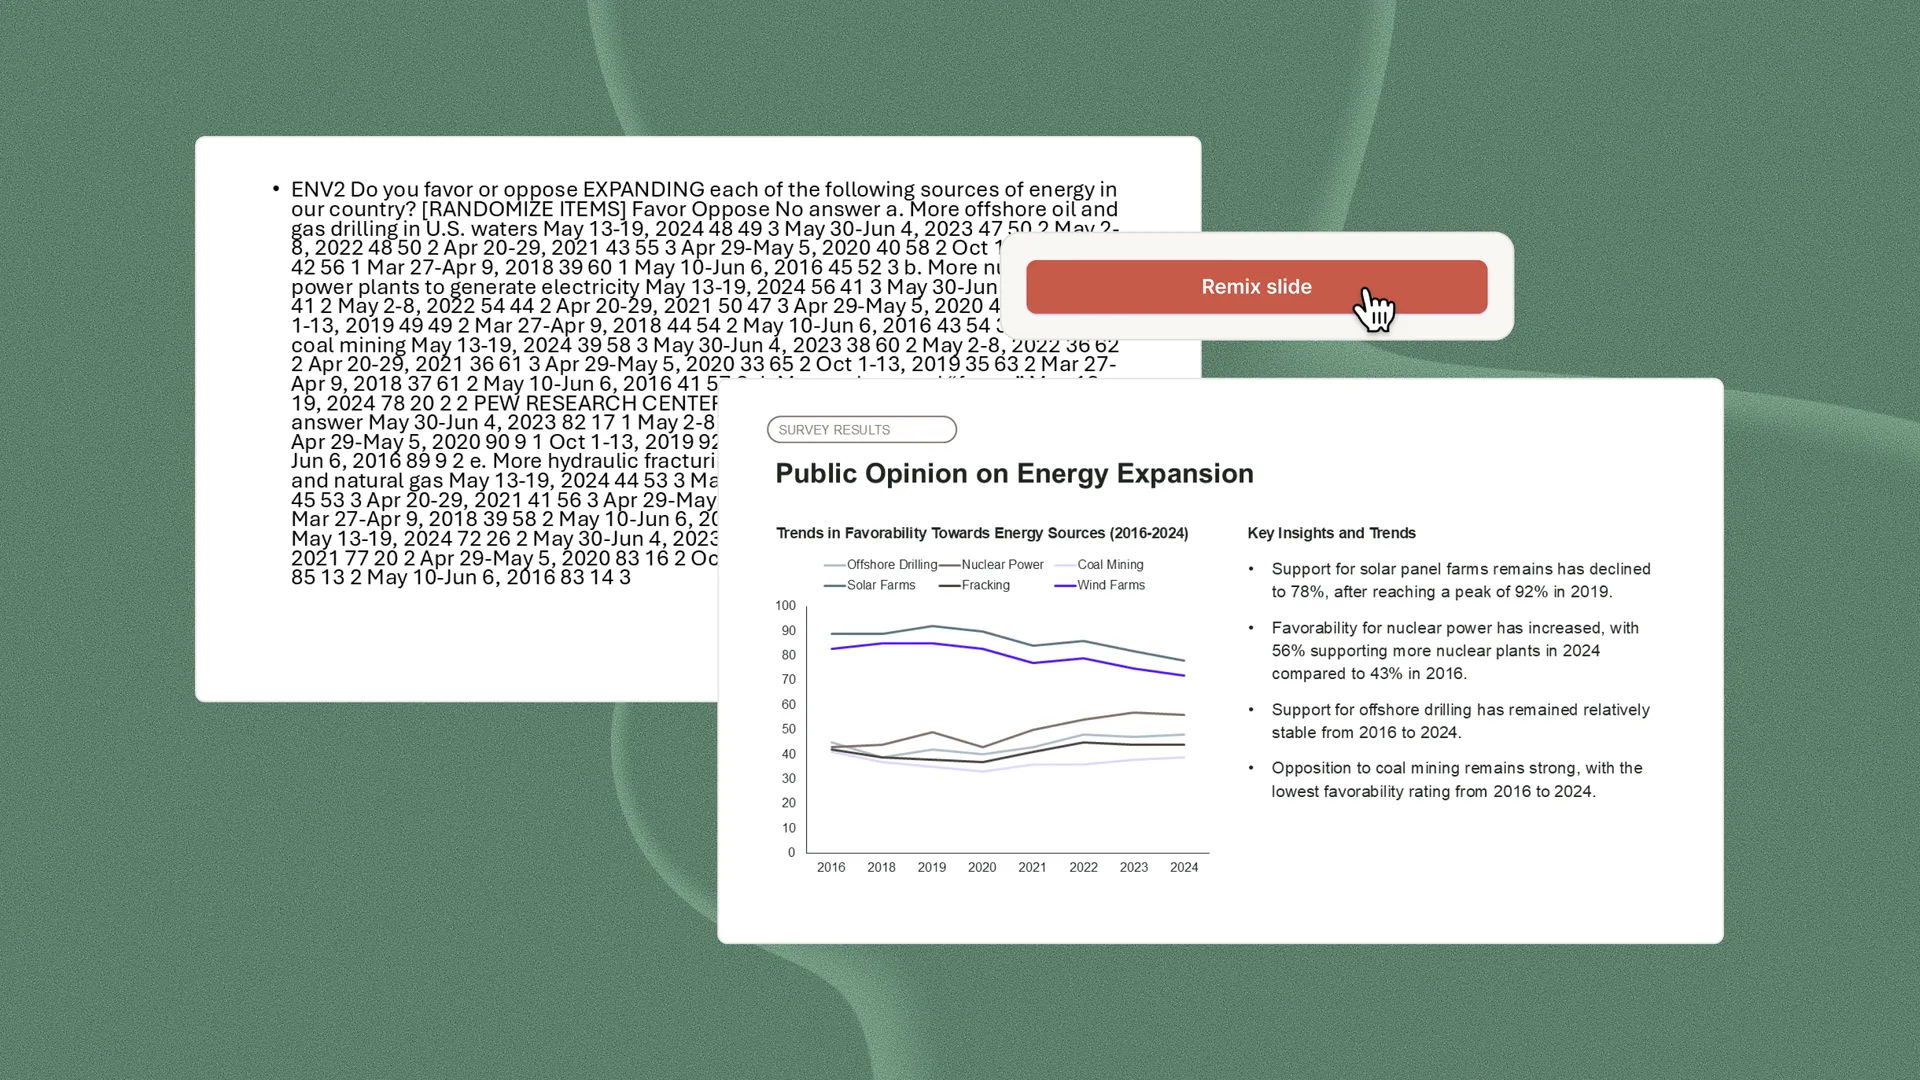
Reformat slides
Remix existing content into polished slides in one click
-
Verwende eine beliebige Sprache
International audience? Translate your presentation into any language.
Häufig gestellte Fragen
Do Plus AI generated charts ever contain hallucinated data?
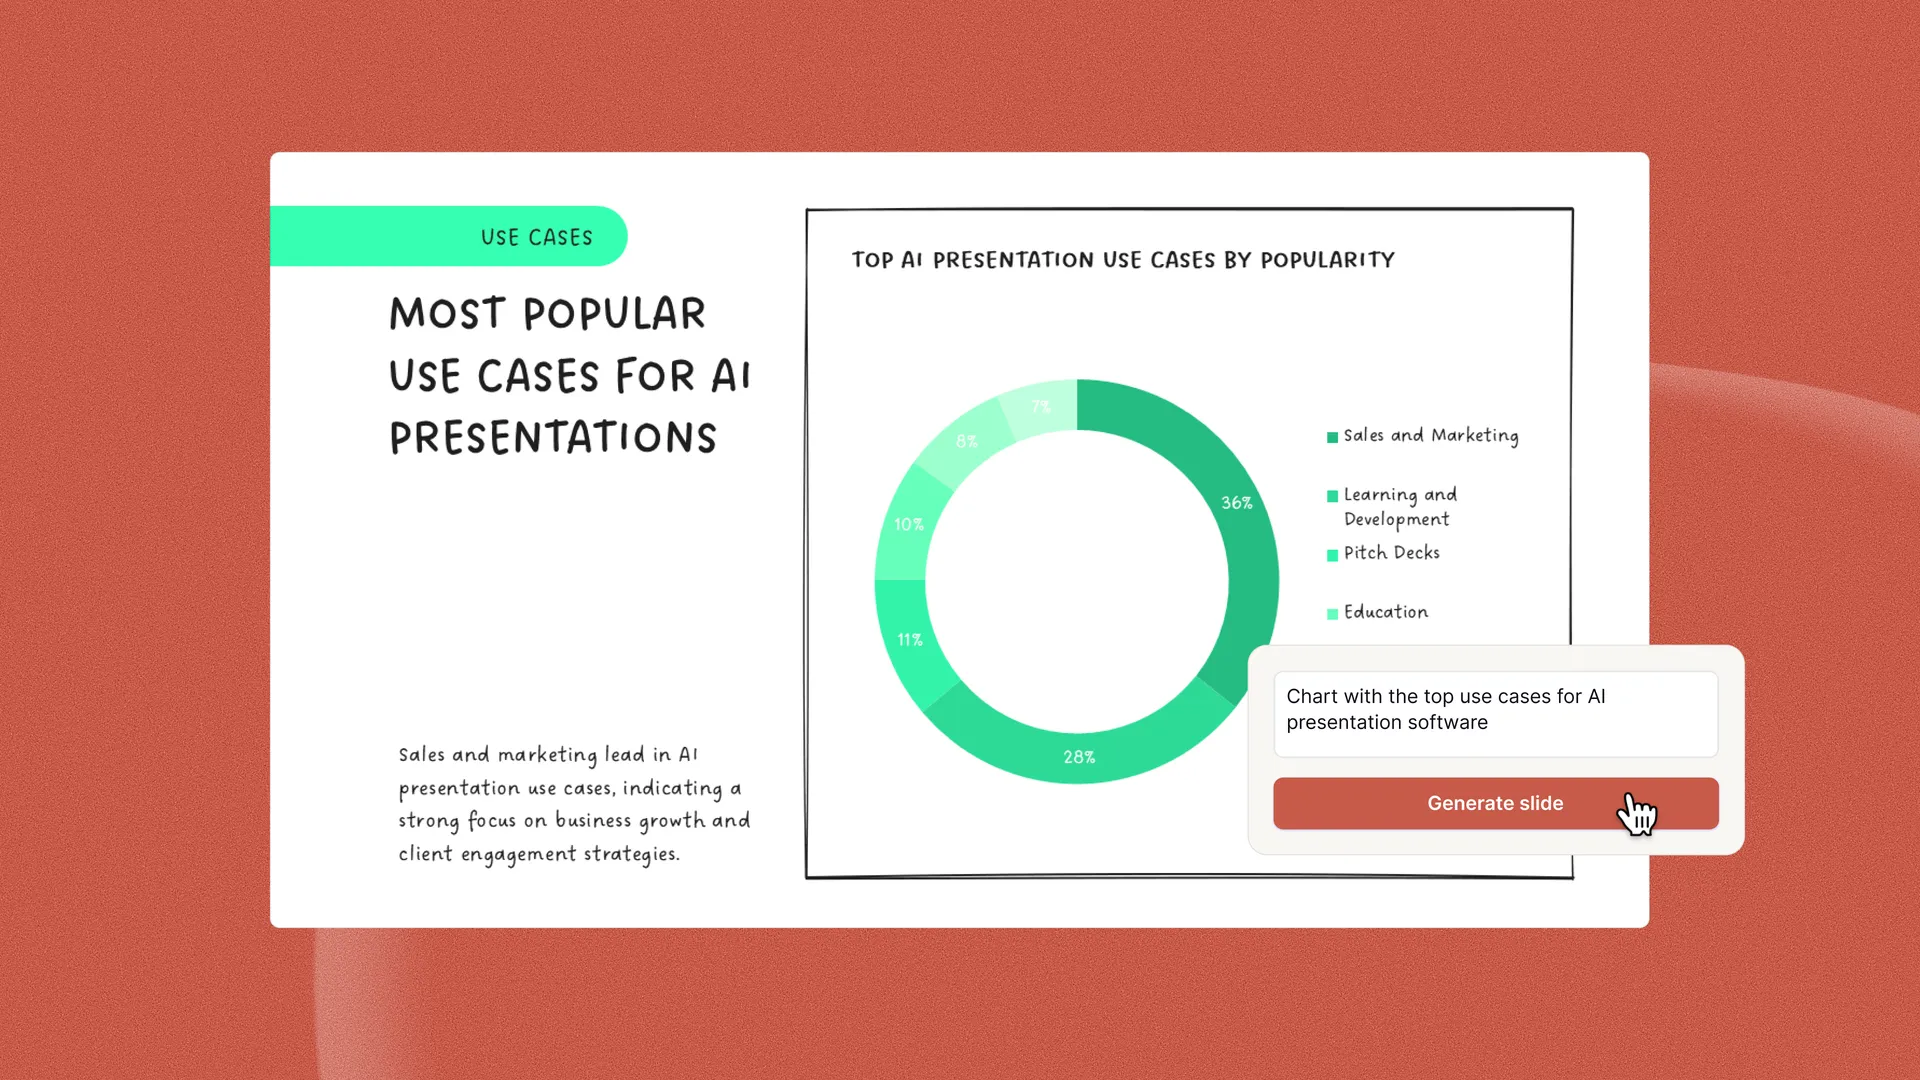
Yes, Plus AI uses the latest AI models to create charts, but large language models (LLMs) are known to hallucinate and create false data, especially if there were no specific data points provided in the input prompt.
For the best performance when generating charts with AI, we recommend including your data in the chart generation prompt, checking the sources of your data (many AI citations are themselves AI-generated and inaccurate), and checking your charts after they are created.
What is the best AI chart generator for PowerPoint?
The best way to generate formatted, styled charts directly in PowerPoint presentation is to use Plus AI.
Plus AI is a AI add-in that allows you to create slides with charts, directly in PowerPoint - without the need to copy and paste images between tools or reformat your charts.
Is there an AI for PowerPoint presentations?
Yes, there are many AI PowerPoint apps you can use to create presentations. The most popular AI tools for PowerPoint are Plus AI and Microsoft Copilot.
What is the best AI presentation generator for people who make slides with charts?
If you need to make PowerPoint presentations with charts using AI, the best solution is Plus AI. Plus AI allows you to create slides, add data, make charts, and edit your presentation - all directly inside of PowerPoint.
Click here to read our in-depth reviews of the best AI presentation generators.
Is AI chart generation included with my Plus AI subscription?
Yes, if you have a Plus Pro or Team subscription, you have unlimited access to Plus AI chart generation.
Is there a free trial for AI chart generation?
Yes, you can try Plus AI for free for 7 days. To create a new slide with a chart, open the "Edit with Plus AI" menu, click Insert -> select Chart slide type -> add a prompt
Does Copilot have an AI chart generator?
Yes, you can use Copilot to generate charts, but the chart functionality only works inside of Copilot for Excel.
If you want to use AI-generated charts in PowerPoint, you will need to copy and paste your chart into PowerPoint and reformat and restyle it in your presentation.
Does Gemini have an AI chart generator?
Yes, you can use Gemini to generate charts using Gemini in Google Slides.
However, if you need to use your chart in Google Slides you will have to copy and paste it into Google Slides and then reformat and restyle it.
Can ChatGPT generate charts?
Yes, you can use ChatGPT to generate charts using AI. After processing your data, ChatGPT will typically use an open source charting library like matplotlib to generate visualizations.
If you would like to use the chart in a presentation, you will probably need to paste it onto your slide as an image or recreate the chart in another tool.
Verschwenden Sie keine Zeit mehr mit Folien.
Testen Sie Plus AI kostenlos. Starten Sie mit einer 7-tägigen kostenlosen Testversion. Jederzeit kündbar.
Kostenlos loslegen