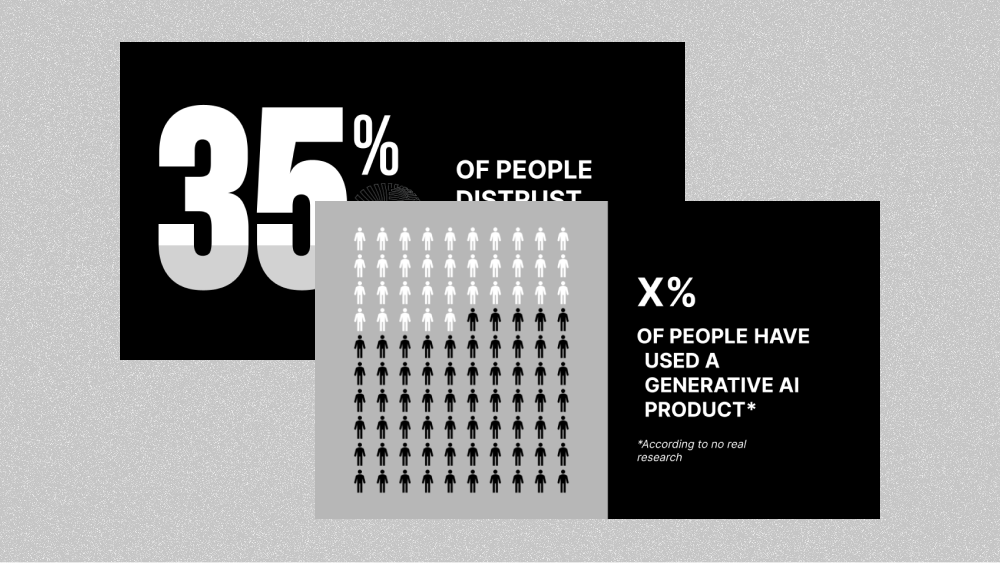
Blue data visualizations
A blue-hued theme including several aesthetic charts and data visualizations for use in Google Slides and PowerPoint presentations
Get this template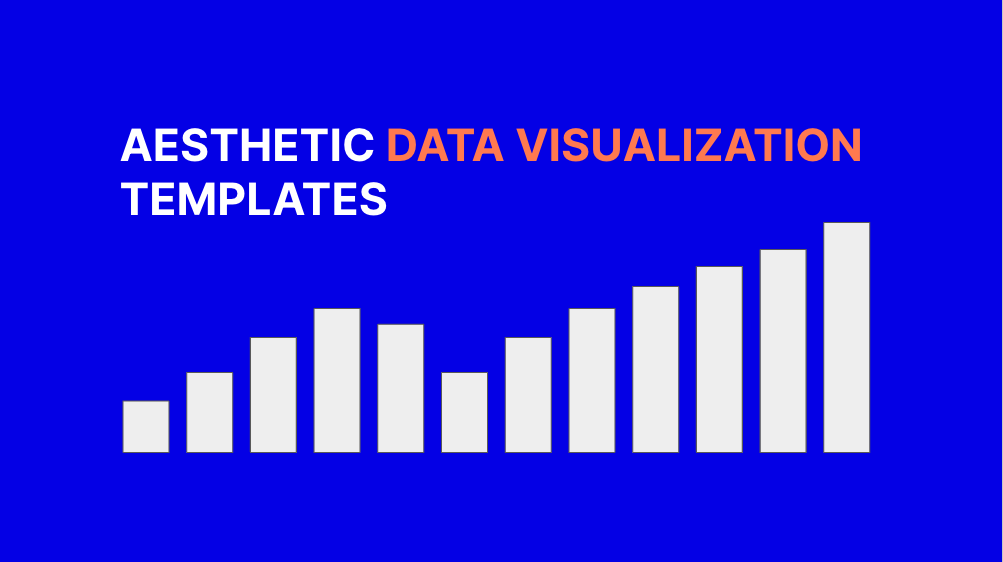


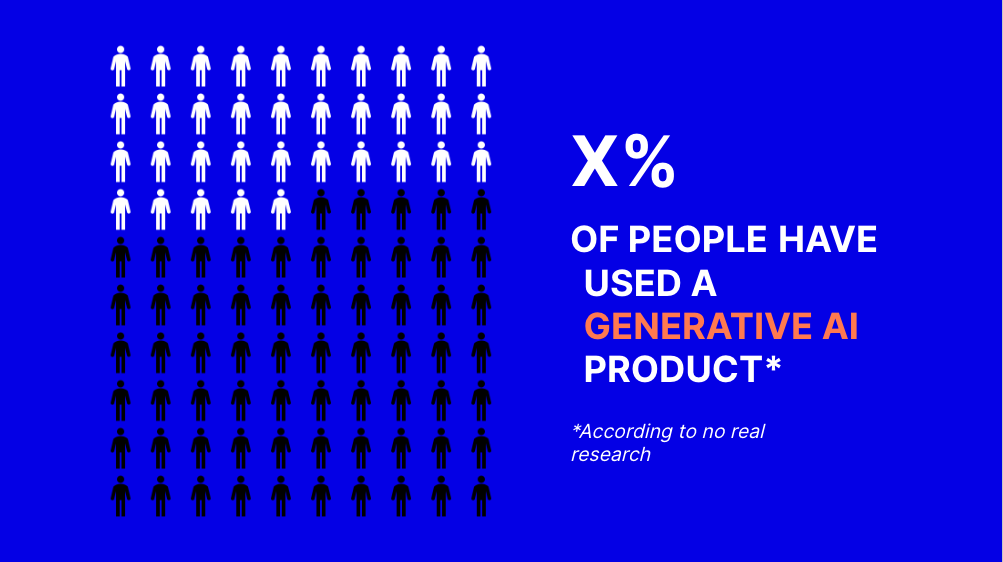

An effective presentation often includes presenting data to get your point across. However if the data is not visualized in an easy-to-understand way, it might lose its effect. This deck includes several aesthetic slides focused on visualizing data in a creative and easy-to-understand way.
A standout color scheme can give your presentation a more personal feel. This version of our Google Slides template for data visualization features a strong blue aesthetic. Feel free to use this same color scheme or use it as inspiration with your own colorful aesthetic.
Features of this slide template
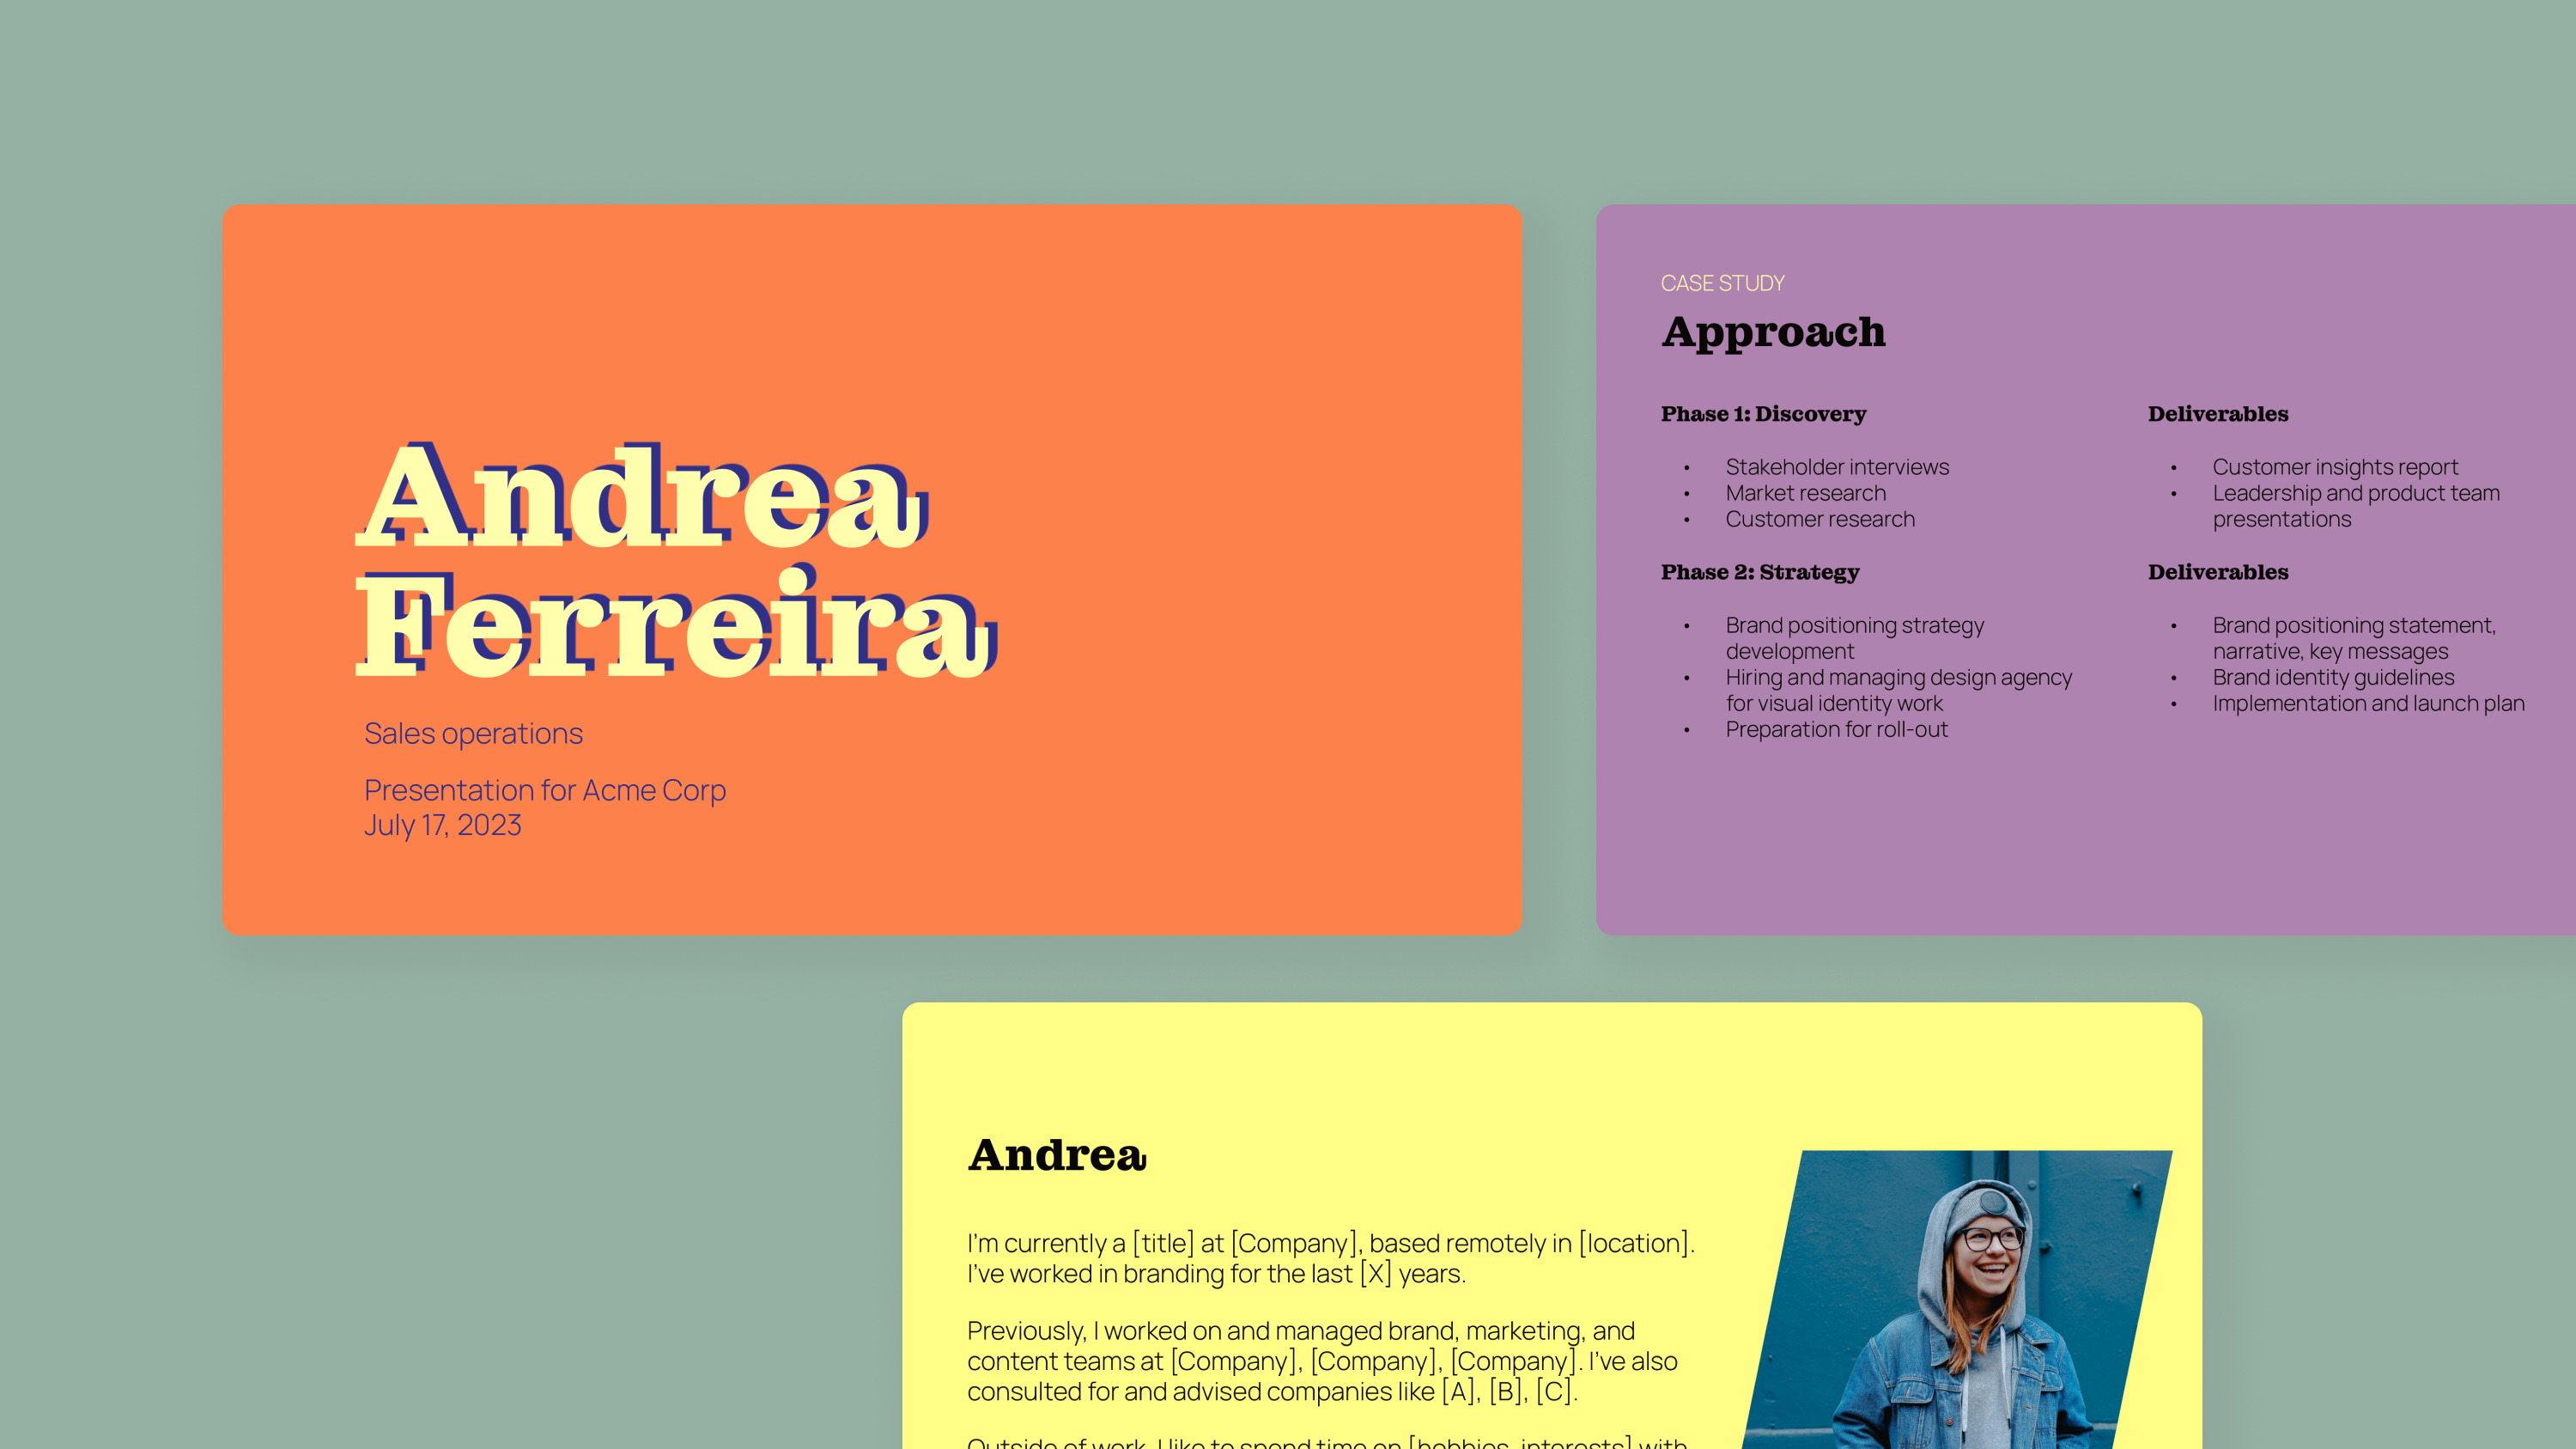
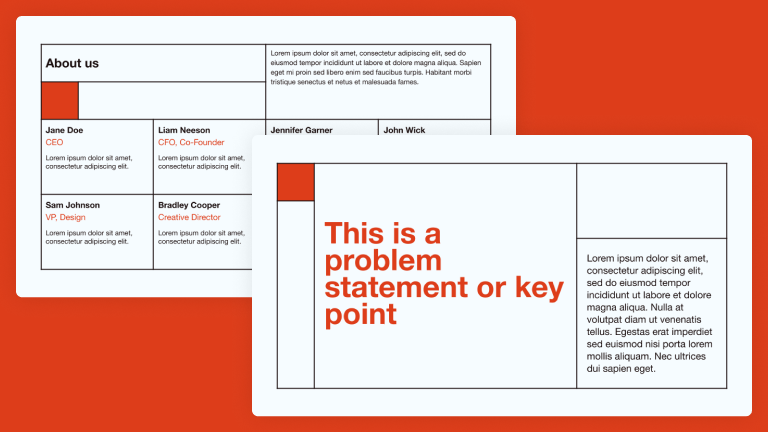
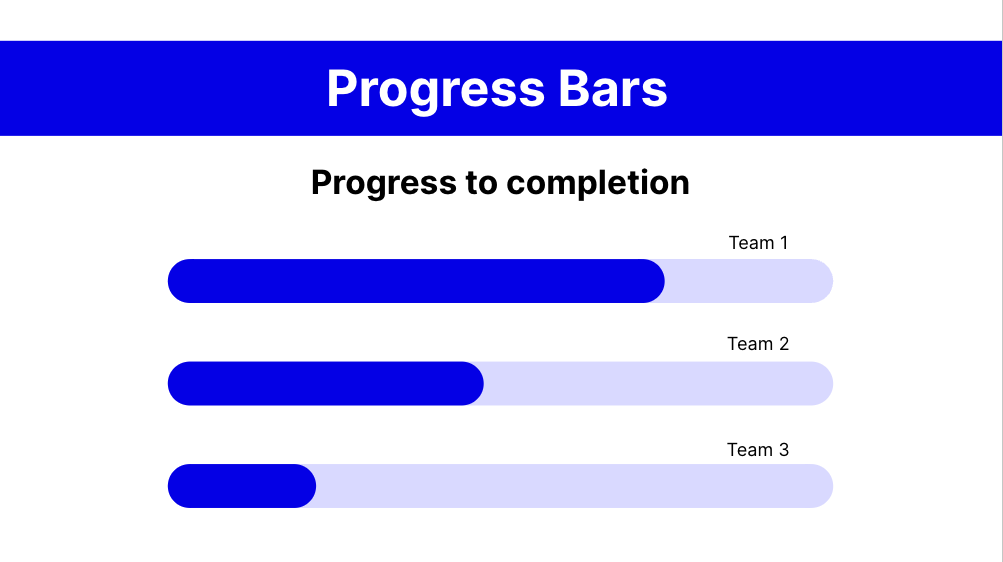
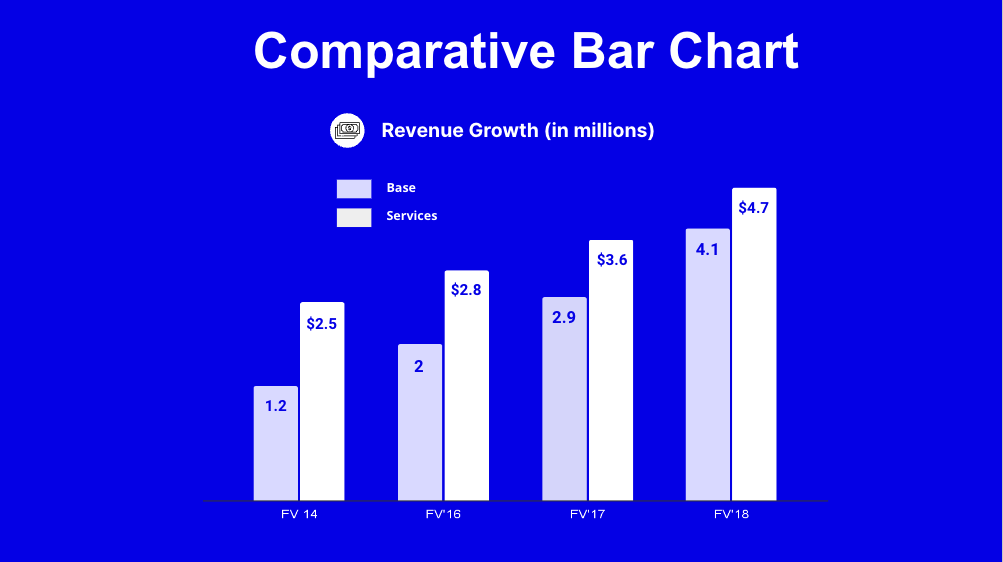
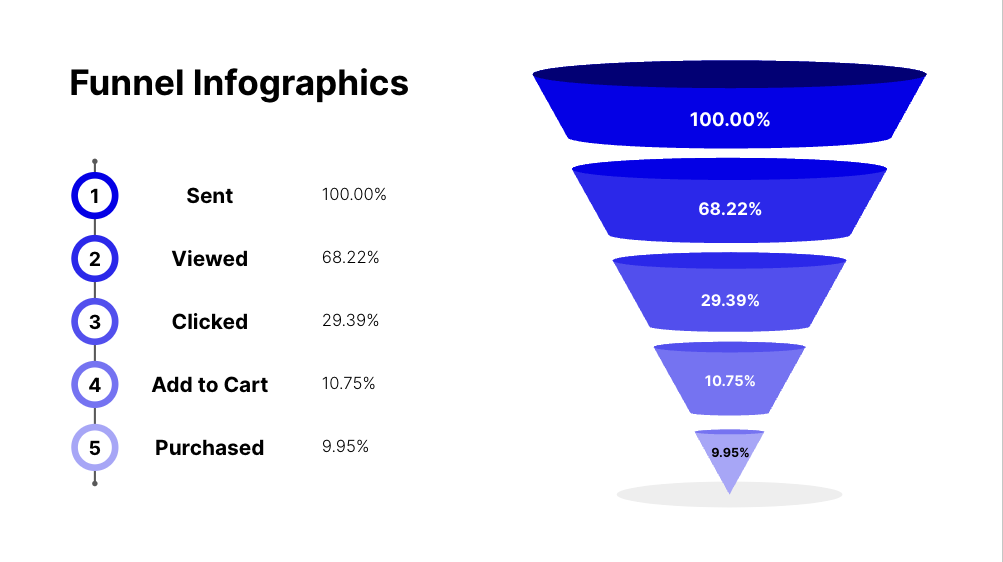
- Template includes 8 different aesthetic charts
- Slides made in Google Slides can also be used in PowerPoint
- Consistent blue and white theme applicable to many uses
Keep exploring
- Black & White Data Visualization Slides
- Academic Research Template (soft light theme)
- Presentation Templates with a Professional Look
- Converting Text Documents to Slides
- Free AI Presentation Maker (Plus AI)
Plus AI for Google Slides & PowerPoint
How to use this template
Generate a custom presentation using this template in a few clicks.
Get this template- Install Plus AI for Google Slides or PowerPoint.
- Launch the add-in to create a new presentation.
- Go to “Start from a template” and select your template.
- Enter a prompt or upload a file to generate a custom presentation.
- Continue editing with Insert, Remix, and Rewrite.